Chart GBP/USD Update: Back at range highs - daily studies improving
The anticipated break below congestion support at 1.3500 has not been seen
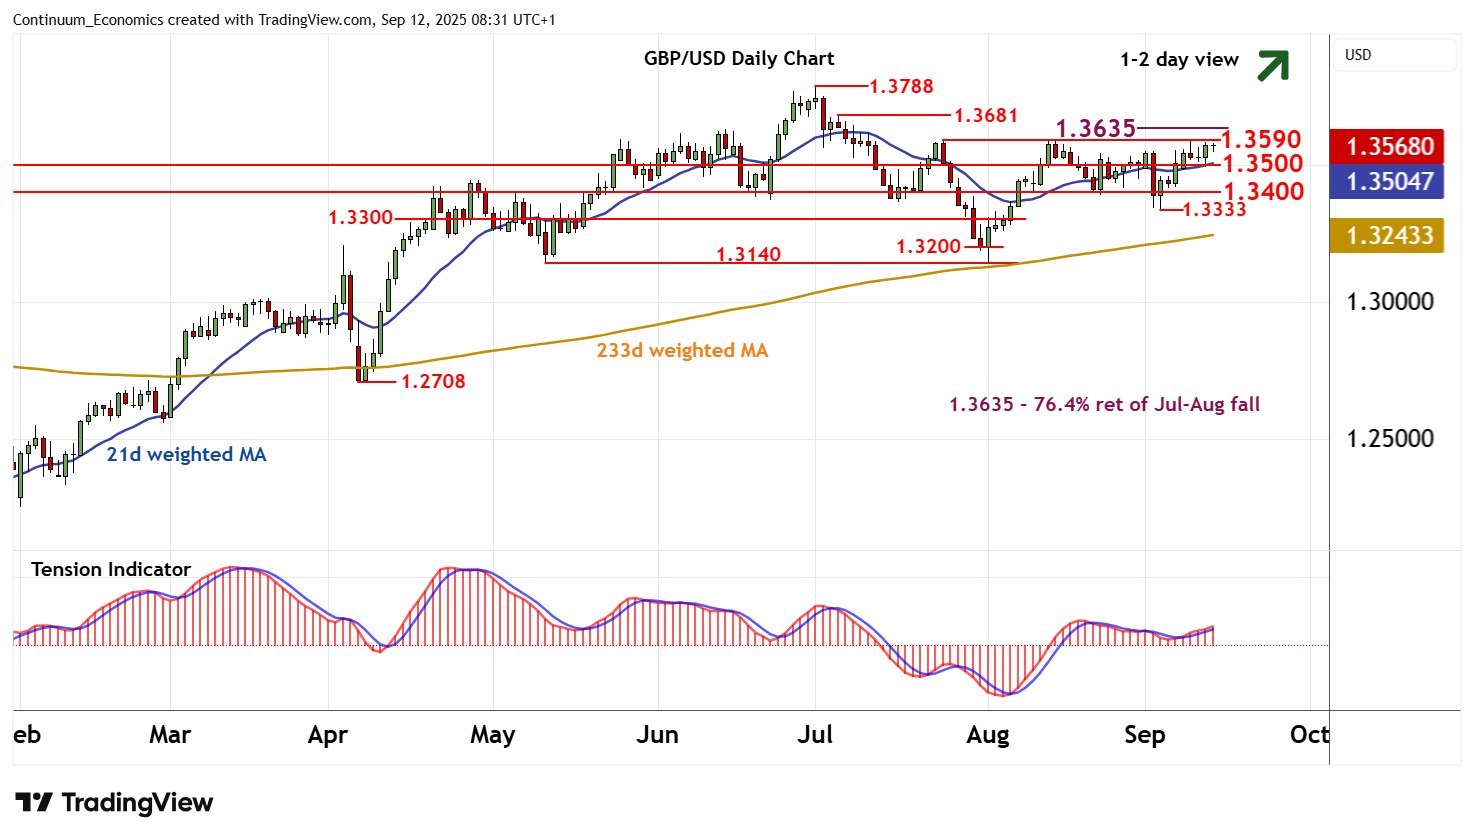
| Level | Comment | Level | Comment | |||||
|---|---|---|---|---|---|---|---|---|
| R4 | 1.3788 | ** | 1 Jul YTD high | S1 | 1.3500 | ** | congestion | |
| R3 | 1.3681 | 4 Jul high | S2 | 1.3400 | * | congestion | ||
| R2 | 1.3635 | ** | 76.4% ret of Jul-Aug fall | S3 | 1.3333 | * | 3 Sep low | |
| R1 | 1.3590/00 | ** | 24 Jul (w) high; cong | S4 | 1.3300 | * | congestion |
Asterisk denotes strength of level
08:10 BST - The anticipated break below congestion support at 1.3500 has not been seen, as unwinding oversold intraday studies prompt a sharp bounce back to resistance at the 1.3590 weekly high of 24 July and congestion around 1.3600. Intraday studies have turned mixed, suggesting cautious trade around here. But daily readings have turned higher and weekly stochastics have also ticked up, suggesting room for a later break towards the 1.3635 Fibonacci retracement. The bearish weekly Tension Indicator could limit any initial tests in fresh consolidation. Meanwhile, support remains at 1.3500. A close beneath here, if seen, will add weight to sentiment and open up further congestion around 1.3400, where renewed consolidation is expected to appear.