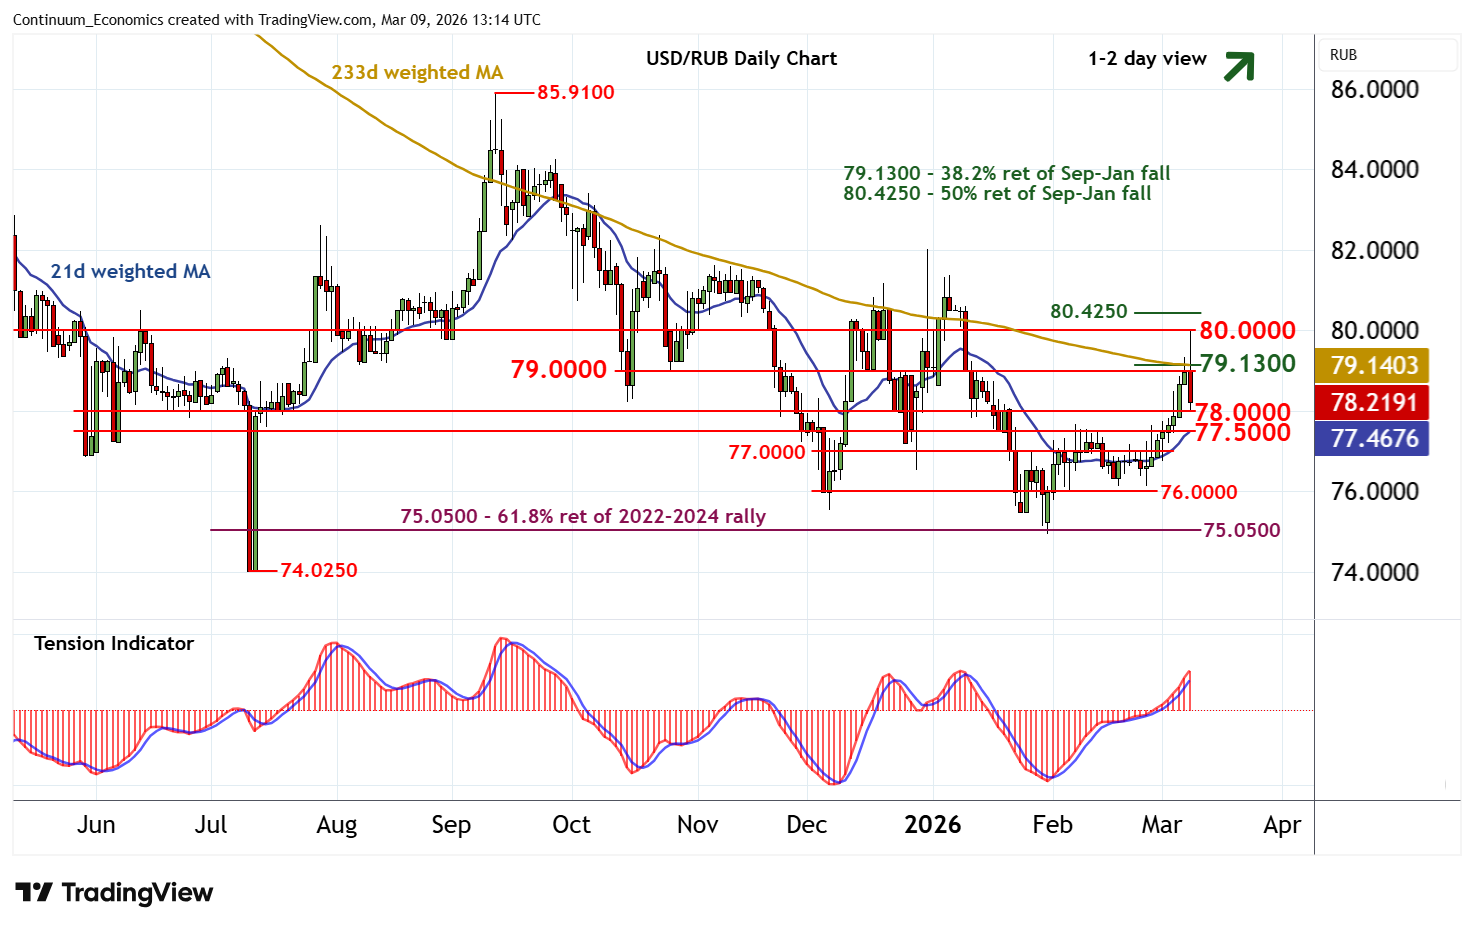
Chart USD/RUB Update: Spike higher not sustained - but studies continue to rise
Anticipated gains have spiked back above resistance at 79.0000 and the 79.1300 Fibonacci retracement to reach 80.0000
| Levels | Comment | Levels | Comment | |||||
| R4 | 80.4250 | ** | 50% ret of Sep-Jan fall | S1 | 78.0000 | * | break level | |
| R3 | 80.0000 | ** | break level | S2 | 77.5000 | * | congestion | |
| R2 | 79.1300 | * | 38.2% ret of Sep-Jan fall | S3 | 77.0000 | * | congestion | |
| R1 | 79.0000 | * | break level | S4 | 76.0000 | * | congestion |
Asterisk denotes strength of level
13:00 GMT - Anticipated gains have spiked back above resistance at 79.0000 and the 79.1300 Fibonacci retracement to reach 80.0000, before falling back to support at 78.0000. Unwinding overbought daily stochastics highlight potential for a test below 78.0000 towards congestion around 77.5000. But the positive daily Tension Indicator and rising weekly charts should limit any tests in renewed buying interest/consolidation. A close beneath here, however, will turn sentiment neutral and give way to consolidation above further congestion around 77.0000. Following choppy/cautious trade, fresh gains are looked for. But a close above 79.1300 is needed to improve sentiment and extend late-January gains back to 80.0000. Beyond here is the 80.4250 retracement, where profit-taking pressure is expected to appear.