Chart AUD/USD Update: Under pressure
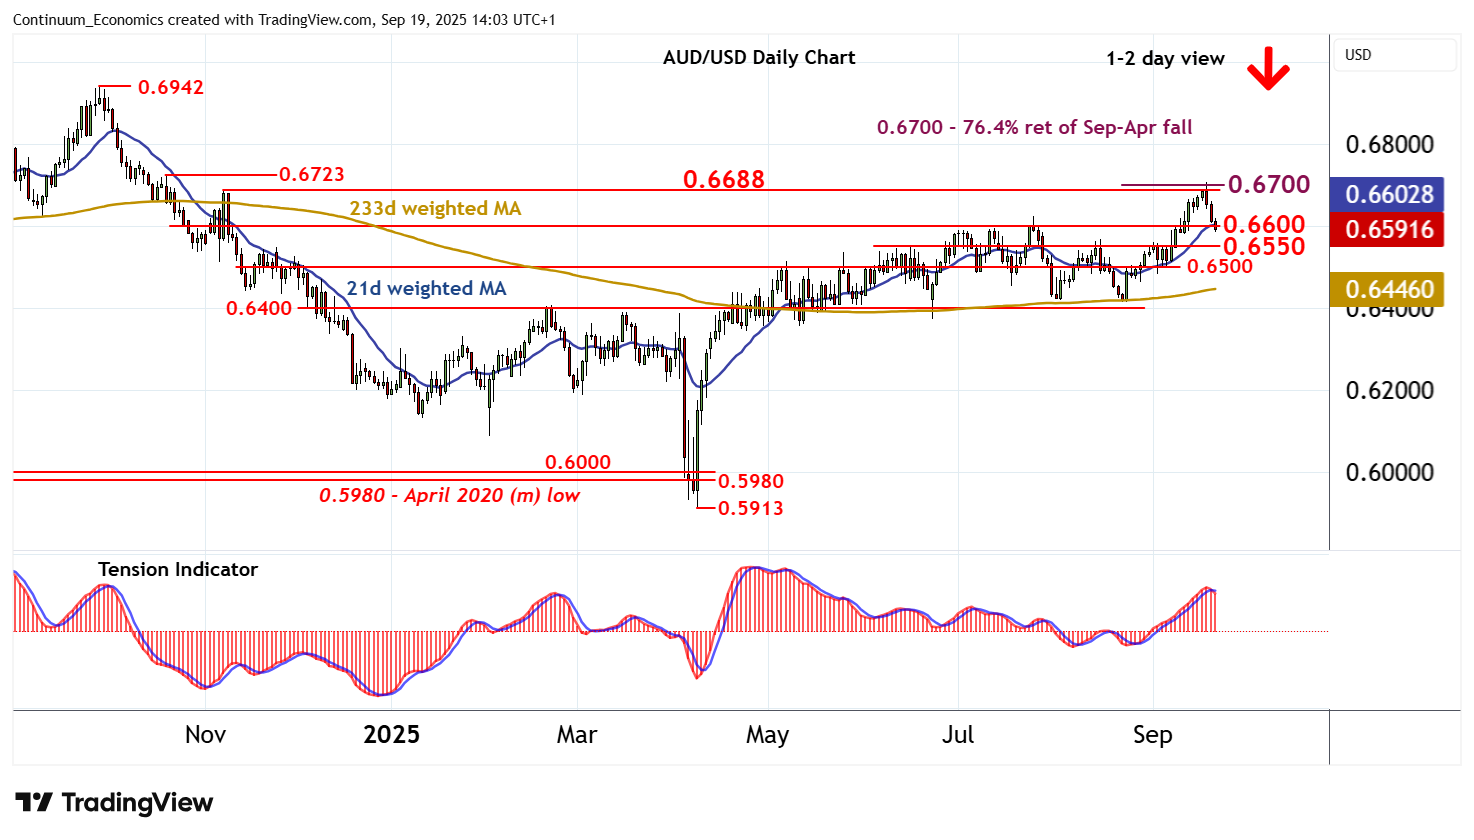
Anticipated losses have reached congestion support at 0.6600
| Levels | Imp | Comment | Levels | Imp | Comment | |||
|---|---|---|---|---|---|---|---|---|
| R4 | 0.6800 | * | break level | S1 | 0.6600 | ** | congestion | |
| R3 | 0.6723 | 21 Oct (w) high | S2 | 0.6550 | * | congestion | ||
| R2 | 0.6700 | ** | 76.4% ret of Sep-Apr fall | S3 | 0.6500 | * | congestion | |
| R1 | 0.6688 | ** | 7 Nov (m) high | S4 | 0.6400 | ** | congestion |
Asterisk denotes strength of level
14:00 BST - Anticipated losses have reached congestion support at 0.6600, with prices currently trading just beneath here around 0.6590. Intraday studies are under pressure and daily readings are also deteriorating, highlighting room for deeper losses in the coming sessions. A break below 0.6600 will add weight to sentiment and open up 0.6550. But mixed/positive weekly charts should limit any further losses in consolidation above congestion around 0.6500. Meanwhile, a close above resistance at the 0.6700 Fibonacci retracement is needed to turn sentiment positive and confirm continuation of April gains, beyond the 0.6723 weekly high of 21 October towards 0.6800.