Continuum Economics
  • Search
  • About Us
  • Buy
  • Invite A Friend
  • My Basket
  • Articles
  • Calendar
  • Forecasts
  • Events
  • Data
  • Newsletters
  • My Alerts
  • Community
  • Directory
  • About Us
  • Buy
  • Invite A Friend
  • My Basket
  • Articles
    • All
    • Thematic
    • Tactical
    • Asia
    • EMEA
    • Americas
    • Newsletters
    • Freemium
    • Editor's Choice
    • Most Viewed
    • Most Shared
    • Most Liked
  • Calendar
    • Interactive
      • China
      • United States
      • Eurozone
      • United Kingdom
    • Month Ahead
    • Reviews
    • Previews
  • Forecasts
    • Forecasts
    • Key Views
  • Events
    • Media
    • Conference Calls
  • Data
    • Country Insights
    • Shadow Credit Ratings
    • Full CI Data Download
  • Newsletters
  • My Alerts
  • Community
    • FX
    • Fixed Income
    • Macro Strategy
    • Credit Markets
    • Equities
    • Commodities
    • Precious Metals
    • Renewables
  • Directory
  • My Account
  • Notifications Setup
  • Account Details
  • Recent Devices
  • Distribution Lists
  • Shared Free Trials
  • Saved Articles
  • Shared Alerts
  • My Posts
Published: 2025-03-18T17:46:24.000Z

Chartbook: US Chart 10 Year Yield: Choppy trade - background studies under pressure

byMike Macdonald

Senior Technical Strategist
2

The anticipated test above 4.500% has posted a 2025 year high at 4.809%

The anticipated test above 4.500% has posted a 2025 year high at 4.809%,

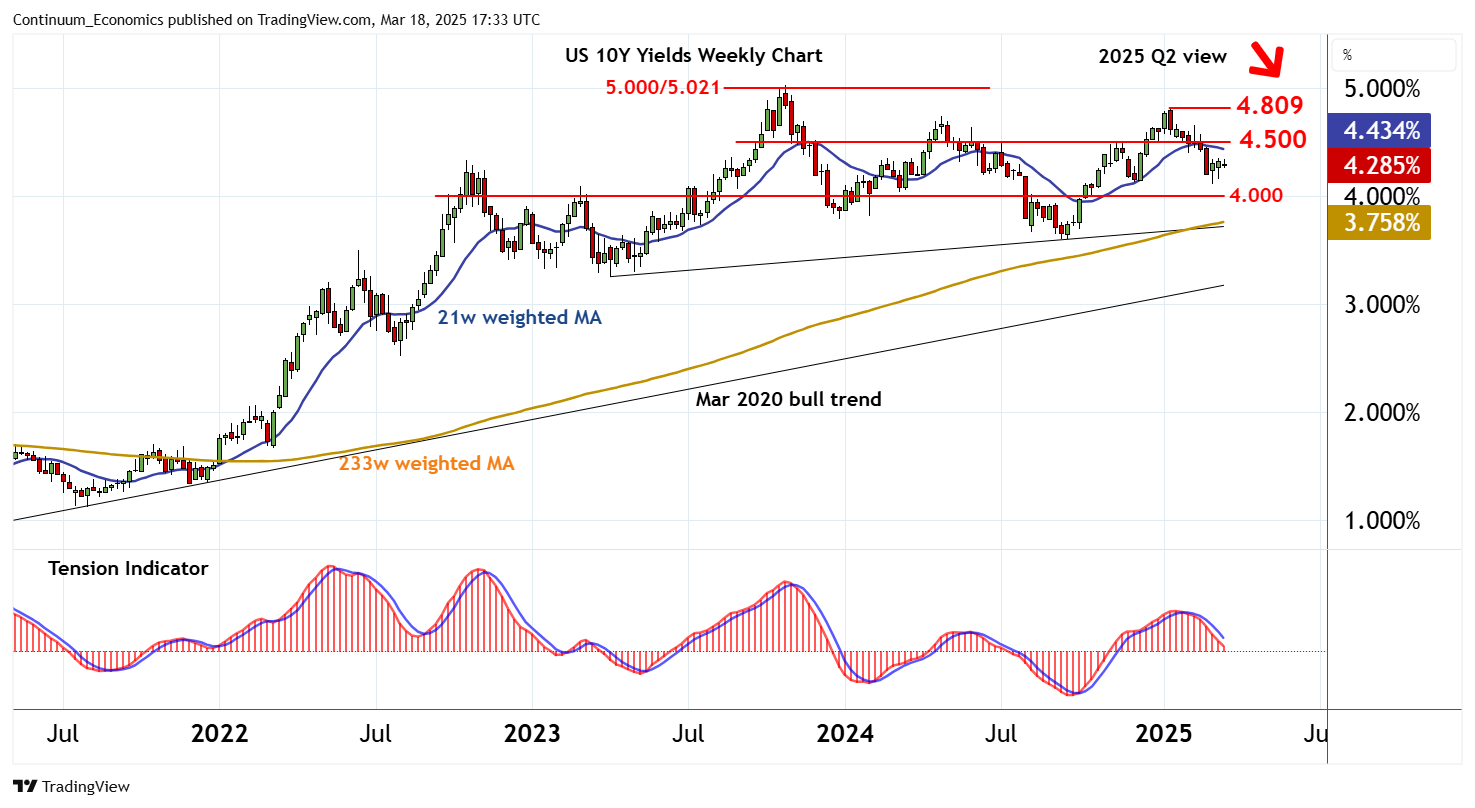
before falling back into cautious trade below 4.500%.

Oversold weekly stochastics are ticking higher, suggesting potential for a retest of 4.500%. But the bearish weekly Tension Indicator and deteriorating monthly charts are expected to limit any break above here in renewed selling interest beneath 4.809%.

Following cautious trade, deteriorating monthly charts highlight room for fresh losses.

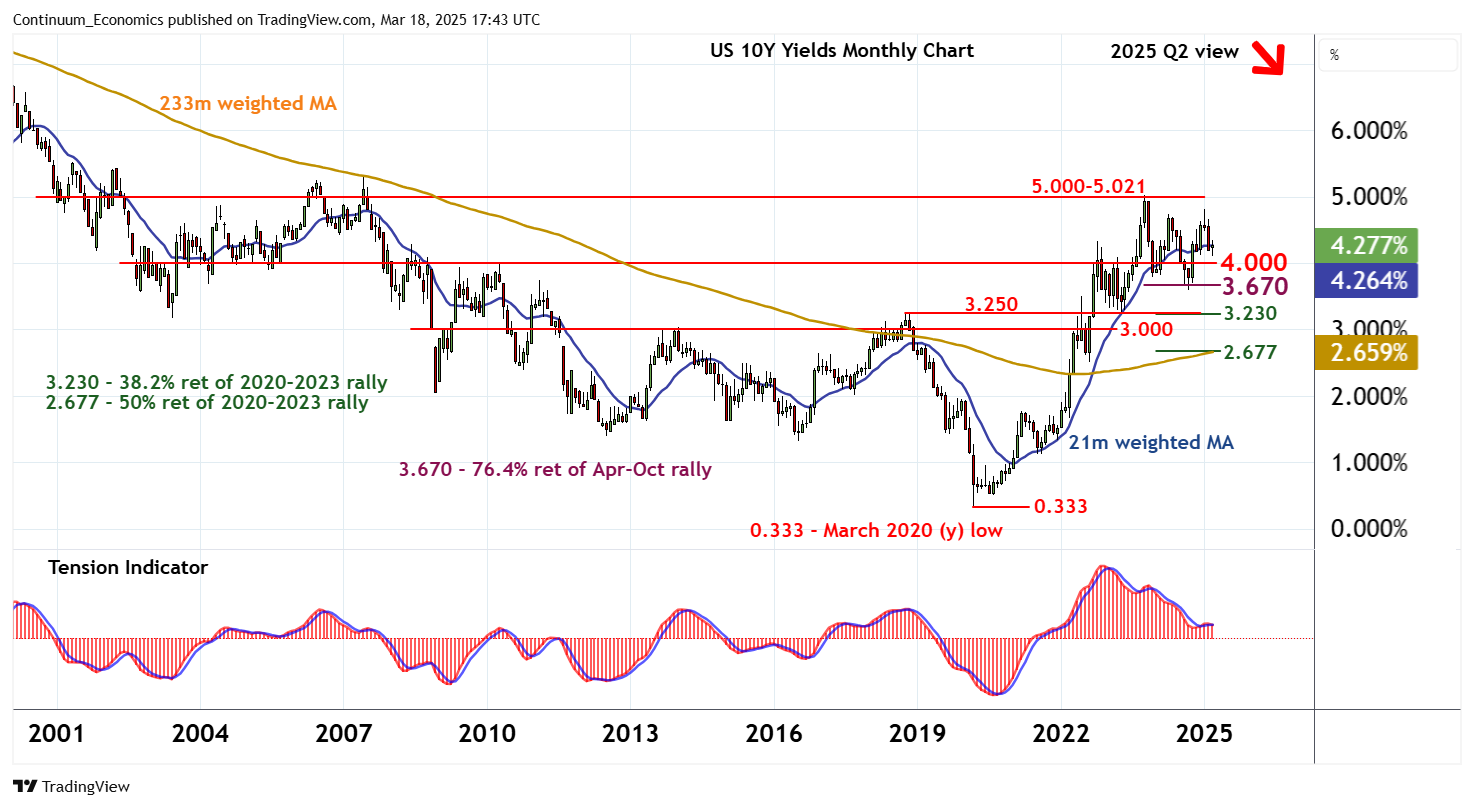
Support is at congestion around 4.000%, with a later break targeting critical support at the 3.670% Fibonacci retracement and the 3.599% year low of September 2024.

Bearish longer-term charts highlight scope for a later break beneath here. This will confirm a significant top in place at 5.000%/5.021% and complete a multi-month distribution top, as a deeper correction of the rally from the 0.333% all-time low of March 2020 develops. Strong support within the 3.250% year high of October 2018 and the 2.230% retracement should initially attract.

Continue to read the article for free
Login

or

or

Topics
Technical Analysis
ChartBook

GENERAL

  • Home
  • About Us
  • Our Team
  • Careers

LEGAL

  • Terms and Conditions
  • Privacy Policy
  • Compliance
  • GDPR

GET IN TOUCH

  • Contact Us
Continuum Economics
The Technical Analyst Awards Winner 2021
The Technical Analyst Awards Finalist 2020
image