Published: 2025-09-12T13:17:50.000Z
Chart EUR/JPY Update: Limited tests higher
0
3
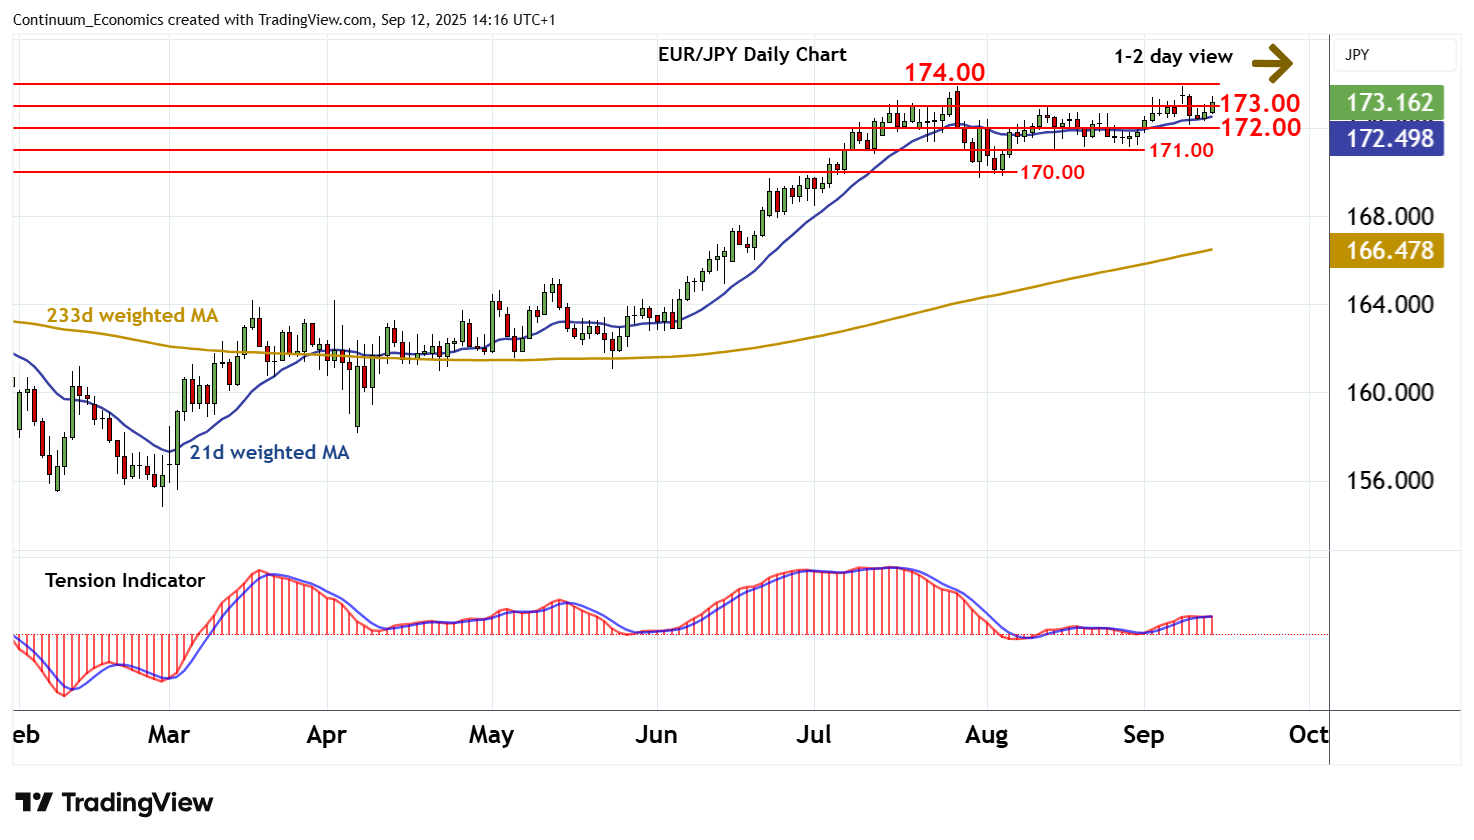
The anticipated break above 173.00 has reached 173.45
| Levels | Imp | Comment | Levels | Imp | Comment | |||
|---|---|---|---|---|---|---|---|---|
| R4 | 176.00 | historic congestion | S1 | 173.00 | * | congestion | ||
| R3 | 175.40 | ** | July 2024 (y) high | S2 | 172.00 | * | break level | |
| R2 | 175.00 | ** | figure | S3 | 171.00 | ** | range lows | |
| R1 | 173.90/00 | ** | 28 Jul YTD high; cong | S4 | 170.00 | ** | congestion |
Asterisk denotes strength of level
13:55 BST - The anticipated break above 173.00 has reached 173.45, where unwinding overbought intraday studies are prompting a minor pullback and consolidation around 173.15. Negative daily readings have ticked higher, suggesting room for further tests higher in the coming sessions. But the flat daily Tension Indicator and bearish weekly charts are expected to limit scope in renewed selling interest beneath strong resistance at the 173.90 current year high of 28 July and congestion around 174.00. Meanwhile, a break back below congestion support at 173.00 will turn sentiment neutral once again and give way to consolidation above 172.00.