Chart USD/CAD Update: Reached 1.3800 - studies under pressure
The anticipated test of congestion support at 1.3800 has extended to 1.3785
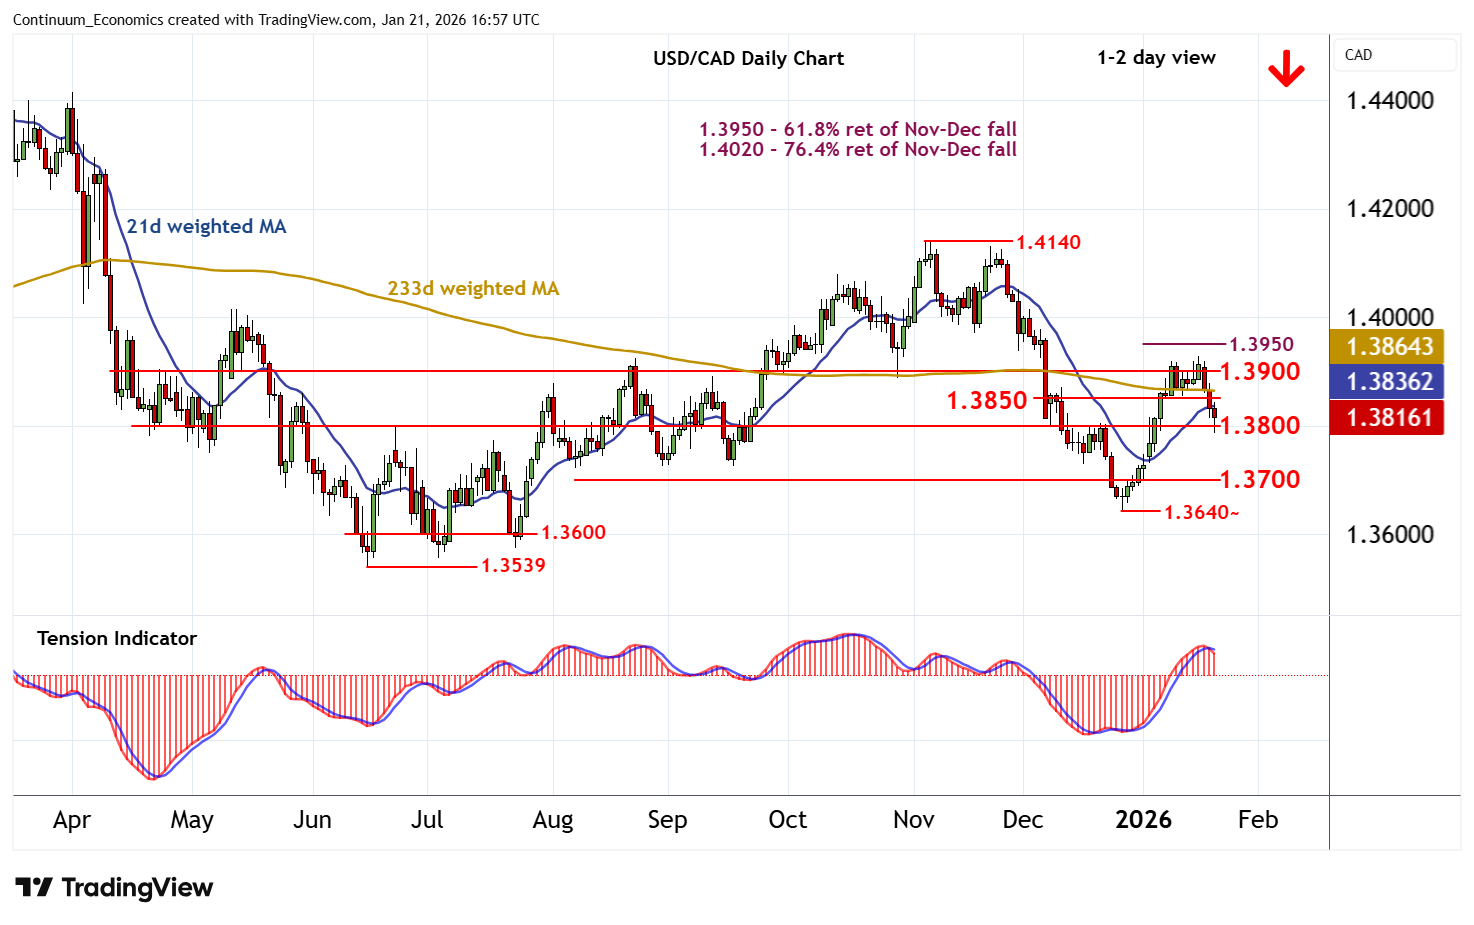
| Levels | Imp | Comment | Levels | Imp | Comment | |||
|---|---|---|---|---|---|---|---|---|
| R4 | 1.4000 | ** | congestion | S1 | 1.3800 | ** | congestion | |
| R3 | 1.3950 | ** | 61.8% ret of Nov-Dec fall | S2 | 1.3700 | * | congestion | |
| R2 | 1.3900/20 | ** | break level; 9 Jan (w) high | S3 | 1.3640 | * | 26 Dec (w) low | |
| R1 | 1.3850 | congestion | S4 | 1.3600 | ** | congestion |
Asterisk denotes strength of level
16:30 GMT - The anticipated test of congestion support at 1.3800 has extended to 1.3785, where mixed intraday studies are prompting a bounce to 1.3815. Daily stochastics continue to fall, unwinding negative divergence, and the daily Tension Indicator is also negative, highlighting room for further losses in the coming sessions. A fresh break below 1.3800 will add weight to sentiment and open up further congestion around 1.3700. However, mixed/positive weekly charts could limit any initial tests in consolidation. Meanwhile, resistance remains at congestion around 1.3850. A close above here, if seen, will help to stabilise price action and prompt consolidation beneath 1.3900/20.