Published: 2025-03-24T11:44:16.000Z
Chartbook: Chart GBP/USD: Strong resistance within 1.3330 - 1.3435

Senior Technical Strategist
-
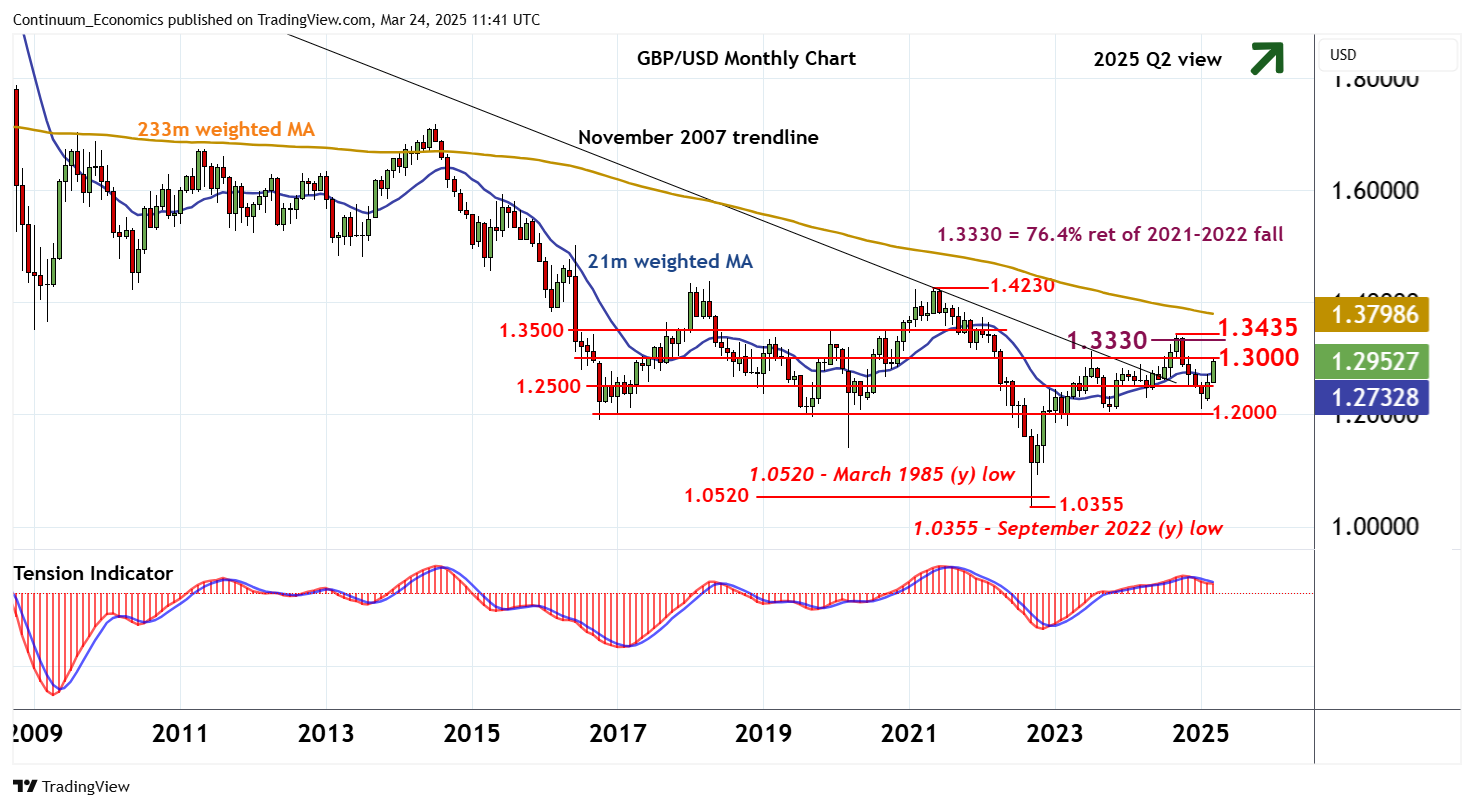
Anticipated losses have met buying interest above strong support at 1.2000
Anticipated losses have met buying interest above strong support at 1.2000,

with steady gains breaking above 1.2500 to test congestion resistance at 1.3000.
Oversold monthly stochastics are unwinding, highlighting potential for a test above here. But the flat monthly Tension Indicator is expected to limit initial scope in fresh consolidation beneath strong resistance at the 1.3330 Fibonacci retracement and the 1.3435 year high of September 2024.
Longer-term charts are showing improvement, however, pointing to a later break above this range and continuation of gains from the 1.0355 multi-decade low of September 2022.
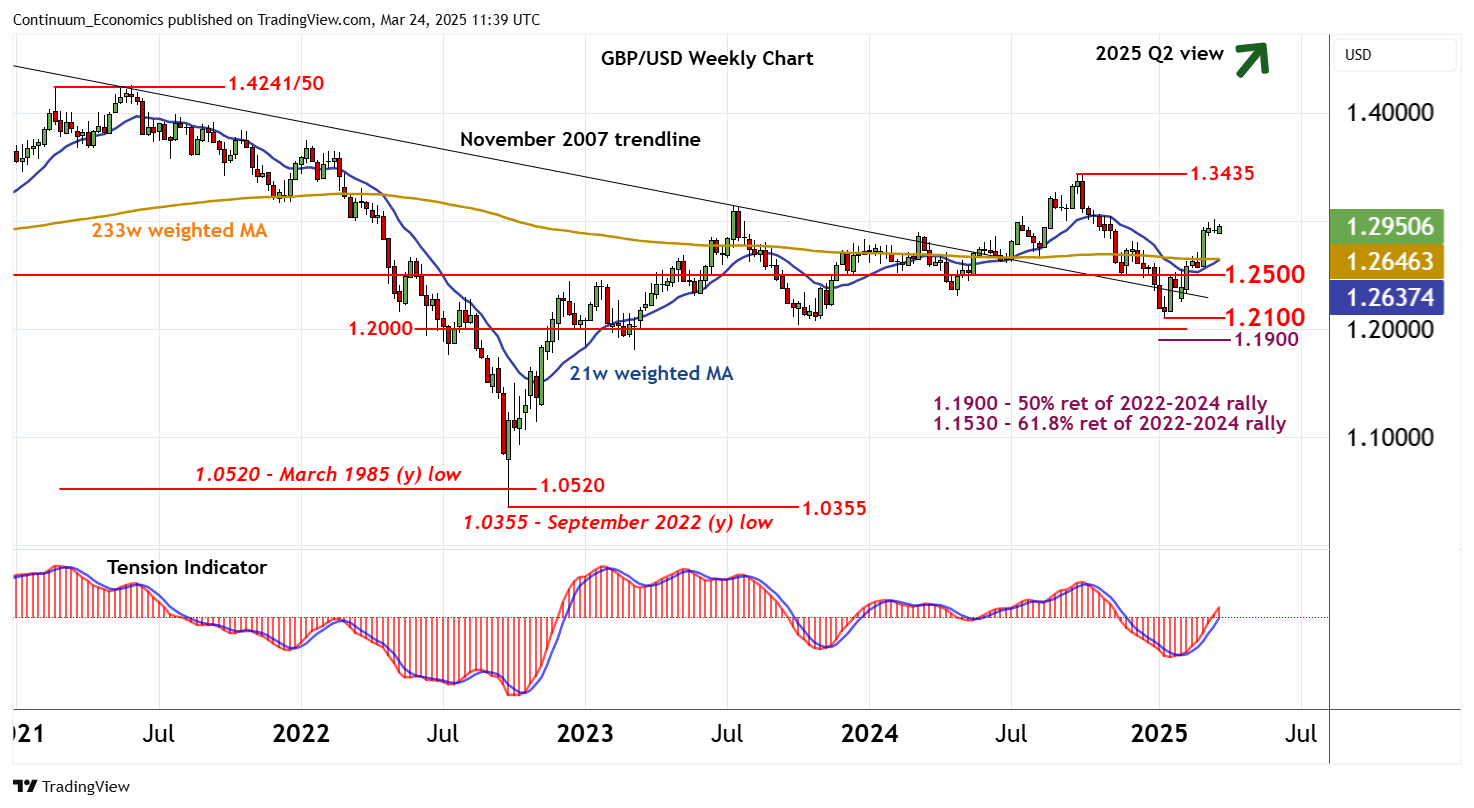
Meanwhile, support is down to congestion around 1.2500,

and is expected to underpin any setbacks as weekly studies rise steadily.
A close beneath here, however, would add weight to sentiment and put focus on critical support at the 1.2100 current year low of 13 January. An unexpected break beneath here would confirm continuation of losses from 1.3435 and extend September losses initially into strong support within the 1.1900 Fibonacci retracement and congestion around 1.2000.