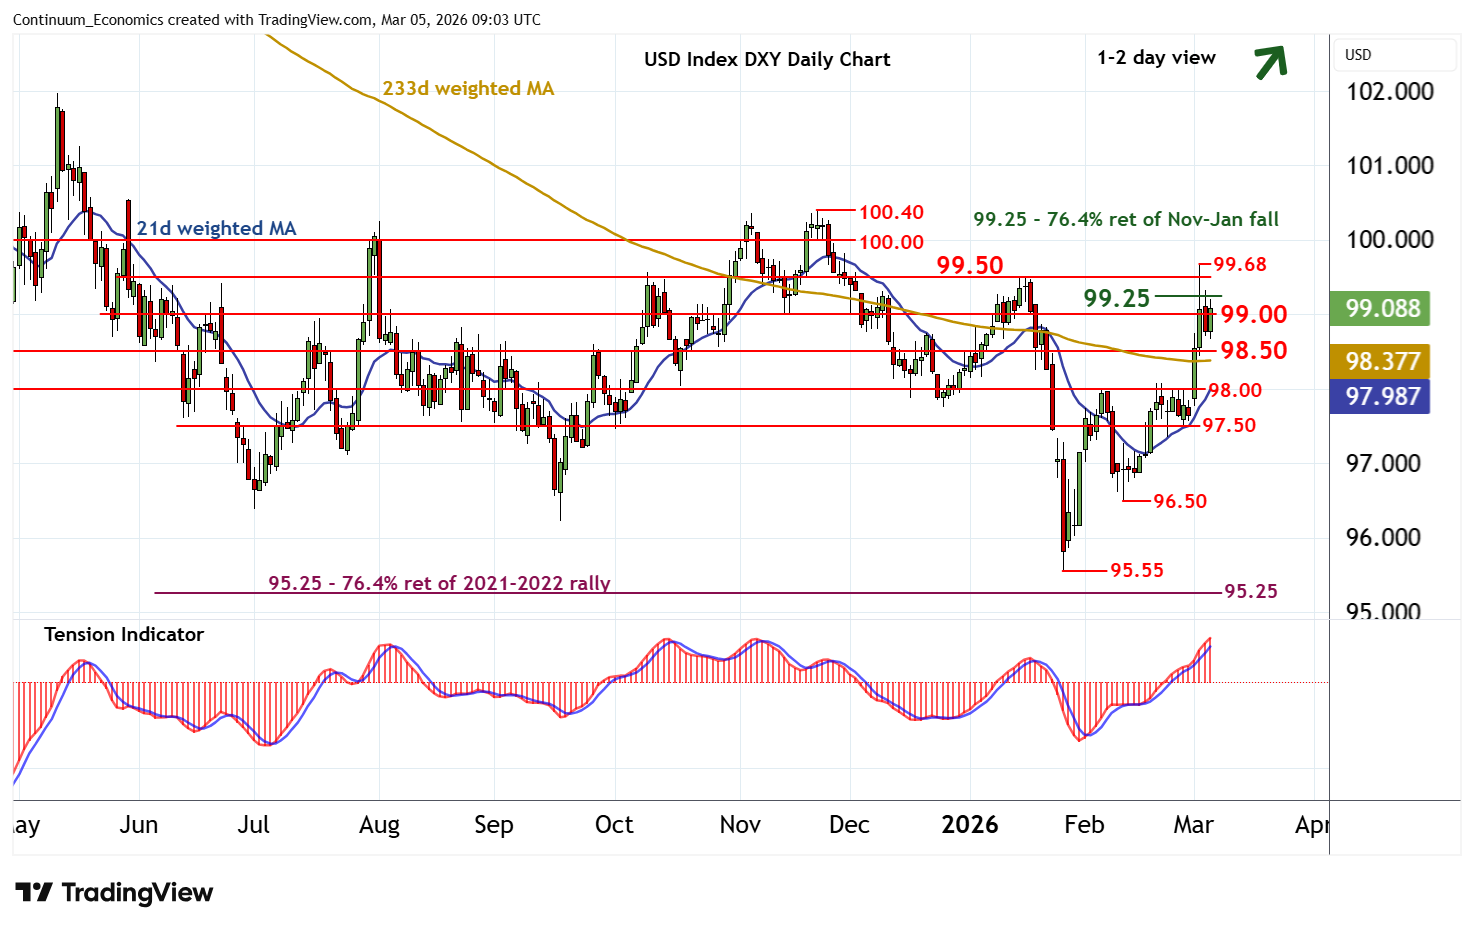
Chart USD Index DXY Update: Choppy in range - studies improving
The anticipated test below 99.00 has bounced from 98.67
| Levels | Imp | Comment | Levels | Imp | Comment | |||
|---|---|---|---|---|---|---|---|---|
| R4 | 100.00 | ** | congestion | S1 | 99.00 | ** | congestion | |
| R3 | 99.68 | 3 Mar YTD high | S2 | 98.50 | * | congestion | ||
| R2 | 99.50 | ** | 15 Jan (m) high, cong | S3 | 98.00 | * | congestion | |
| R1 | 99.25 | ** | 76.4% ret of Nov-Jan fall | S4 | 97.50 | ** | congestion |
Asterisk denotes strength of level
08:45 GMT - The anticipated test below 99.00 has bounced from 98.67, with prices once again trading above congestion support at 99.00. Intraday studies are mixed and overbought daily stochastics are unwinding, suggesting room for further consolidation above here. But the rising daily Tension Indicator and positive weekly charts highlight later gains. Resistance is at the 99.25 Fibonacci retracement. A close above here will improve price action and extend late-January gains beyond 99.50 and the 99.68 current year high of 3 March towards congestion around 100.00. Meanwhile, any fresh tests below 99.00 should meet renewed buying interest above congestion support at 98.50.