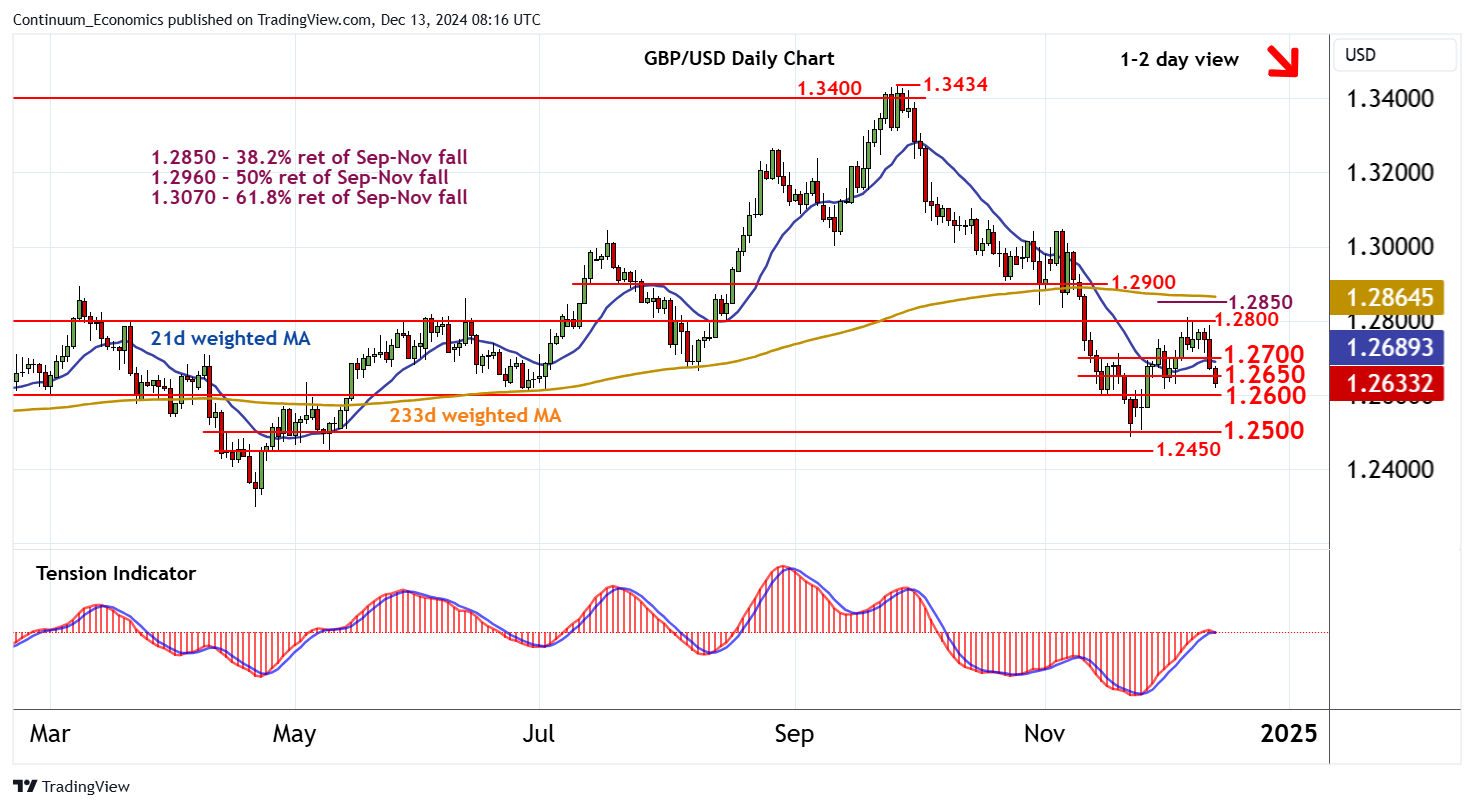
Chart GBP/USD Update: Under pressure

Anticipated losses are accelerating

| Level | Comment | Level | Comment | |||||
|---|---|---|---|---|---|---|---|---|
| R4 | 1.2850 | * | 38.2% ret of Sep-Nov fall | S1 | 1.2600 | * | congestion | |
| R3 | 1.2800 | ** | break level | S2 | 1.2500 | ** | congestion | |
| R2 | 1.2700 | break level | S3 | 1.2450 | * | congestion | ||
| R1 | 1.2650 | congestion | S4 | 1.2400 | * | break level |
Asterisk denotes strength of level
08:05 GMT - Anticipated losses are accelerating, as intraday studies remain under pressure and overbought daily stochastics unwind, with focus turning to congestion support at 1.2600. The daily Tension Indicator has also turned down, highlighting a deterioration in sentiment and potential for continuation beneath here. A break below 1.2600 will add weight to sentiment and open up further congestion around 1.2500. However, oversold weekly stochastics are unwinding, suggesting room for short-covering/consolidation above here, before bearish longer-term charts prompt deeper losses. Meanwhile, resistance is lowered to congestion around 1.2650 and extends to the 1.2700 break level. This area should cap any any immediate tests higher. A break above 1.2700, if seen, would help to stabilise price action and give way to consolidation beneath 1.2800.