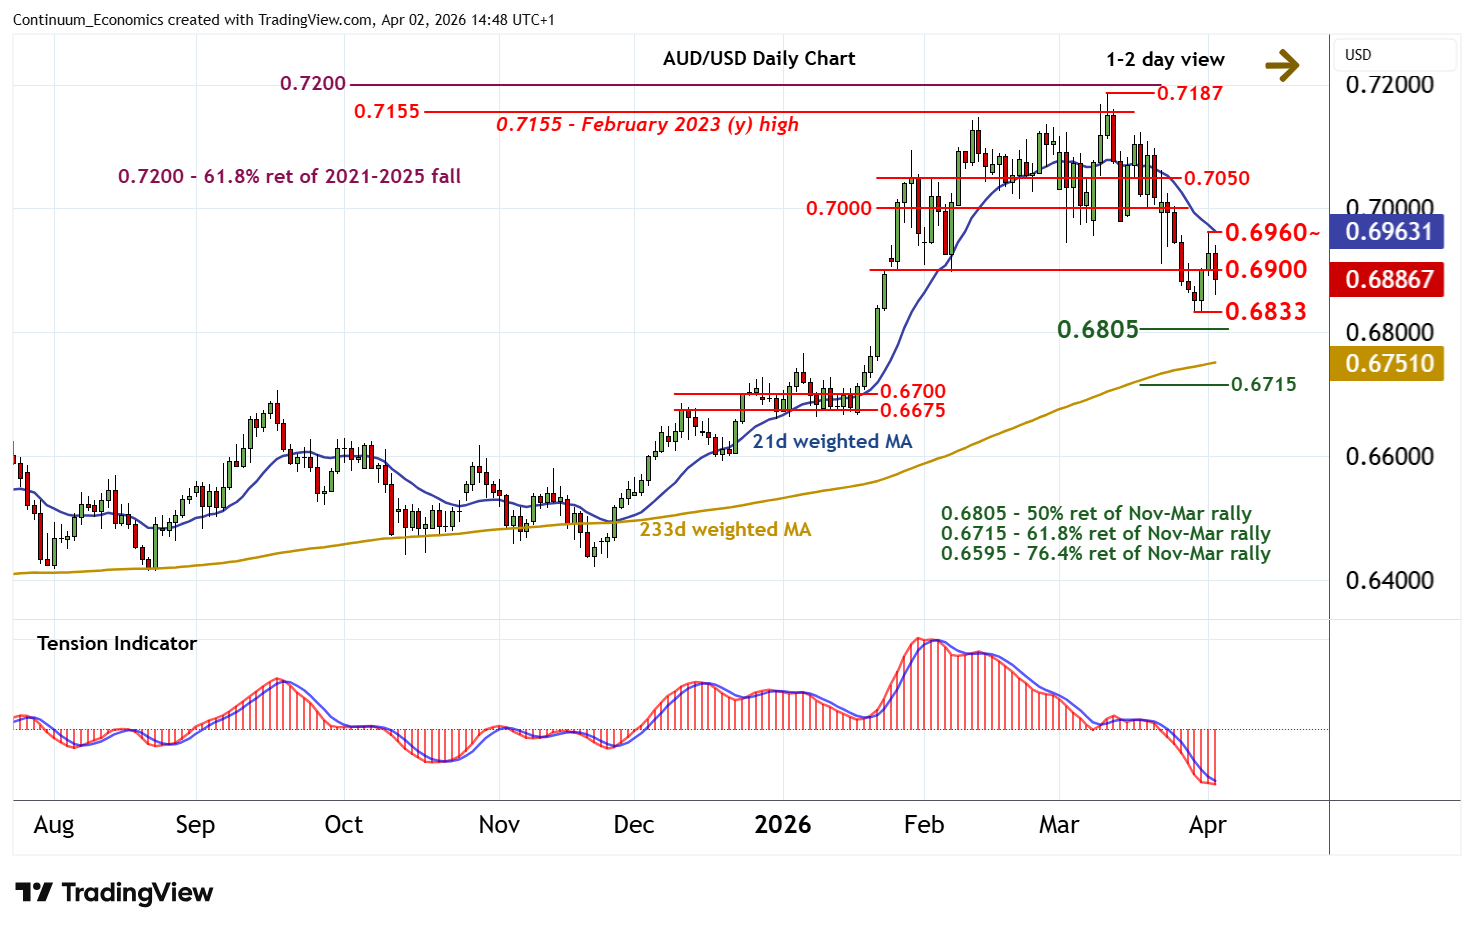
Chart AUD/USD Update: Lower in range - background under pressure
Consolidation beneath the 0.6960 high of 1 April has given way to a sharp pullback
| Levels | Imp | Comment | Levels | Imp | Comment | |||
|---|---|---|---|---|---|---|---|---|
| R4 | 0.7050 | * | congestion | S1 | 0.6833 | ** | 30 Mar (m) low | |
| R3 | 0.7000 | * | congestion | S2 | 0.6805 | ** | 50% ret of Nov-Mar rally | |
| R2 | 0.6960 | 1 Apr high | S3 | 0.6715 | ** | 61.8% ret of Nov-Mar rally | ||
| R1 | 0.6900 | * | break level | S4 | 0.6700 | * | range highs |
Asterisk denotes strength of level
14:45 BST - Consolidation beneath the 0.6960 high of 1 April has given way to a sharp pullback, with the break below 0.6900 reaching 0.6860 before consolidating around 0.6880. Oversold daily stochastics are unwinding, suggesting potential for a test of resistance at 0.6900. But a fresh tick lower in the bearish daily Tension Indicator and negative weekly charts should limit any break in renewed selling interest beneath 0.6960. Following cautious trade, fresh losses are looked for. However, a close below the 0.6833 monthly low of 30 March is needed to turn sentiment negative and extend March losses, initially to the 0.6805 Fibonacci retracement.