Published: 2025-09-09T03:01:13.000Z
Chart USD/THB Update: Extending losses
0
-
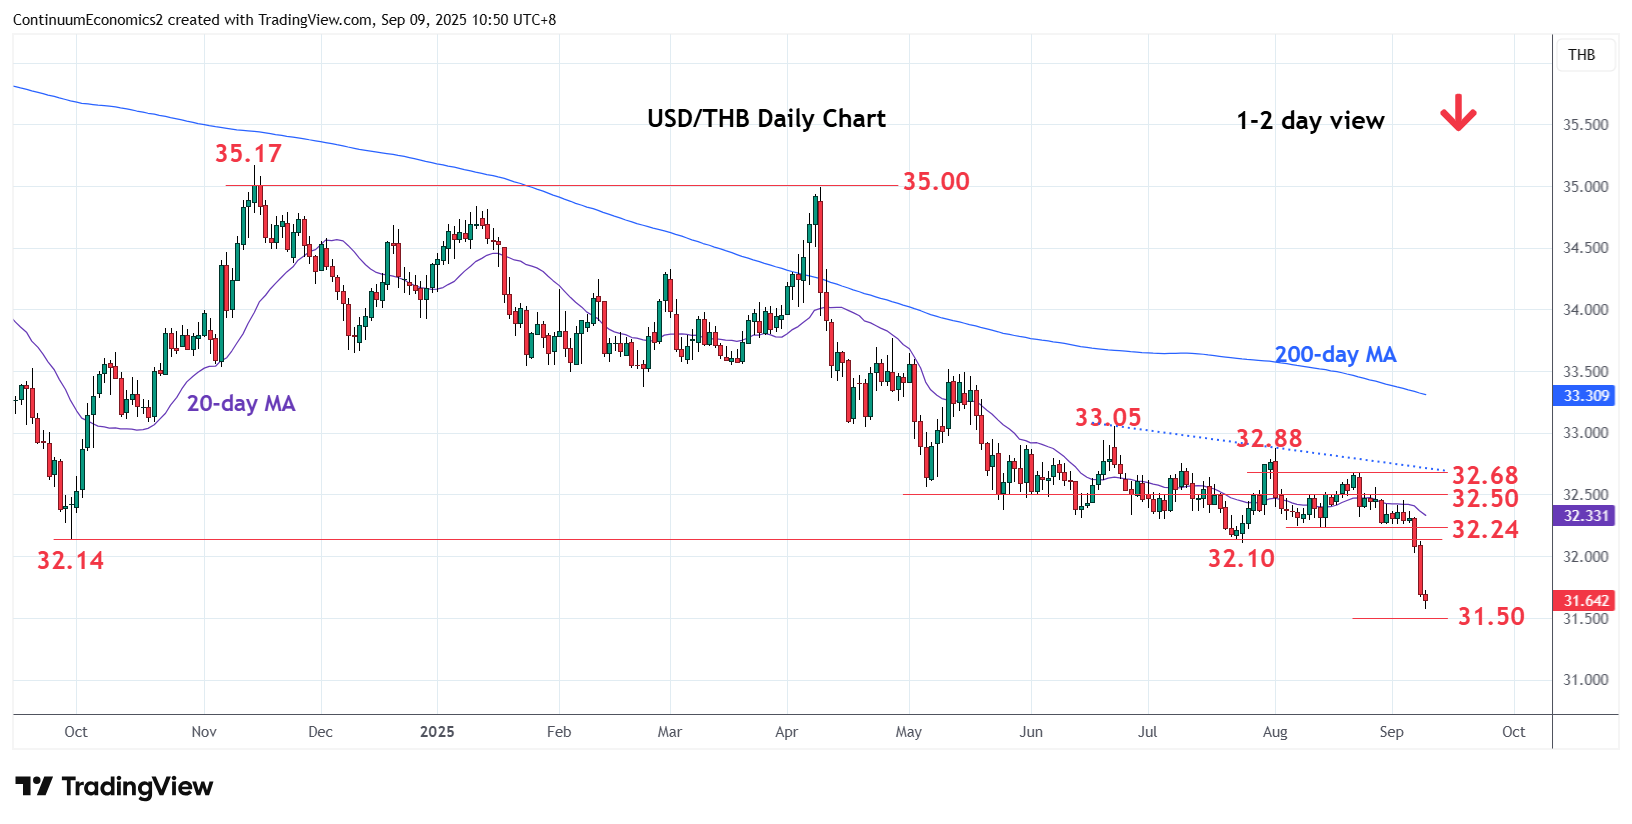
Break of support through the July low at 32.10 and the 32.00 level has seen sharp drop to reach towards the 31.60/50 congestion area
| Level | Comment | Level | Comment | |||||
|---|---|---|---|---|---|---|---|---|
| R4 | 32.40/50 | * | congestion | S1 | 31.60 | * | Apr 2021 high | |
| R3 | 32.24 | * | Aug low | S2 | 31.50 | * | congestion | |
| R2 | 32.10/14 | ** | Jul, 2024 year lows | S3 | 31.20 | * | congestion | |
| R1 | 31.80 | * | congestion | S4 | 31.05 | * | Jun 2021 low |
Asterisk denotes strength of level
02:55 GMT - Break of support through the July low at 32.10 and the 32.00 level has seen sharp drop to reach towards the 31.60/50 congestion area and support from April 2021. Stretched intraday studies suggest consolidation here likely to unwind the oversold readings before giving way to deeper pullback. Lower will see room to 31.20 congestion and 31.05, June 2021 low. Meanwhile, resistance is lowered to the 31.80 and extending to the 32.10/32.14, July and 2024 year lows, now expected to cap and sustain losses from the April high.