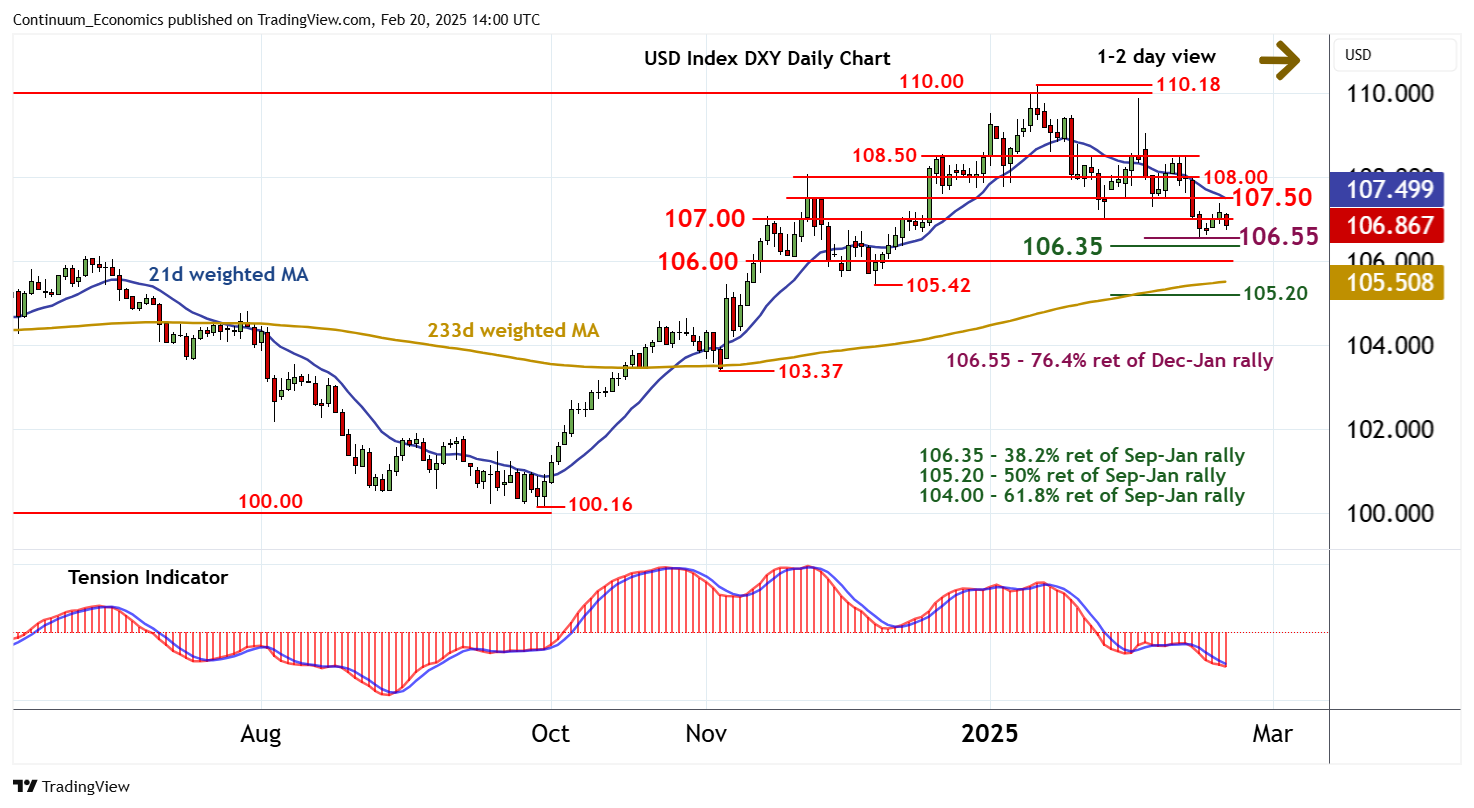
Chart USD Index DXY Update: Focus back on the 106.55 Fibonacci retracement

The test above resistance at 107.00 has been pushed back from 107.35/40
| Levels | Imp | Comment | Levels | Imp | Comment | |||
|---|---|---|---|---|---|---|---|---|
| R4 | 108.50 | minor break level | S1 | 106.55 | ** | 76.4% ret of Dec-Jan rally | ||
| R3 | 108.00 | break level | S2 | 106.35 | ** | 38.2% ret of Sep-Jan rally | ||
| R2 | 107.50 | * | congestion | S3 | 106.00 | ** | congestion | |
| R1 | 107.00 | ** | break level | S4 | 105.42 | ** | 6 Dec (m) low |
Asterisk denotes strength of level
13:50 GMT - The test above resistance at 107.00 has been pushed back from 107.35/40, as overbought intraday studies unwind, with steady losses currently trading around 106.85. Focus is turning to support at the 106.55 Fibonacci retracement, but a tick higher in oversold daily stochastics is expected to limit any immediate tests in consolidation. The daily Tension Indicator is negative, however, and broader weekly charts are bearish, pointing to room for a later break and extension of January losses towards the 106.35 Fibonacci retracement, ahead of congestion around 106.00. Meanwhile, any fresh tests above 107.00 should meet renewed selling interest beneath congestion around 107.50.