Published: 2025-02-27T03:28:45.000Z
Chart USD/IDR Updates: Extending bounce

Technical Analyst
1
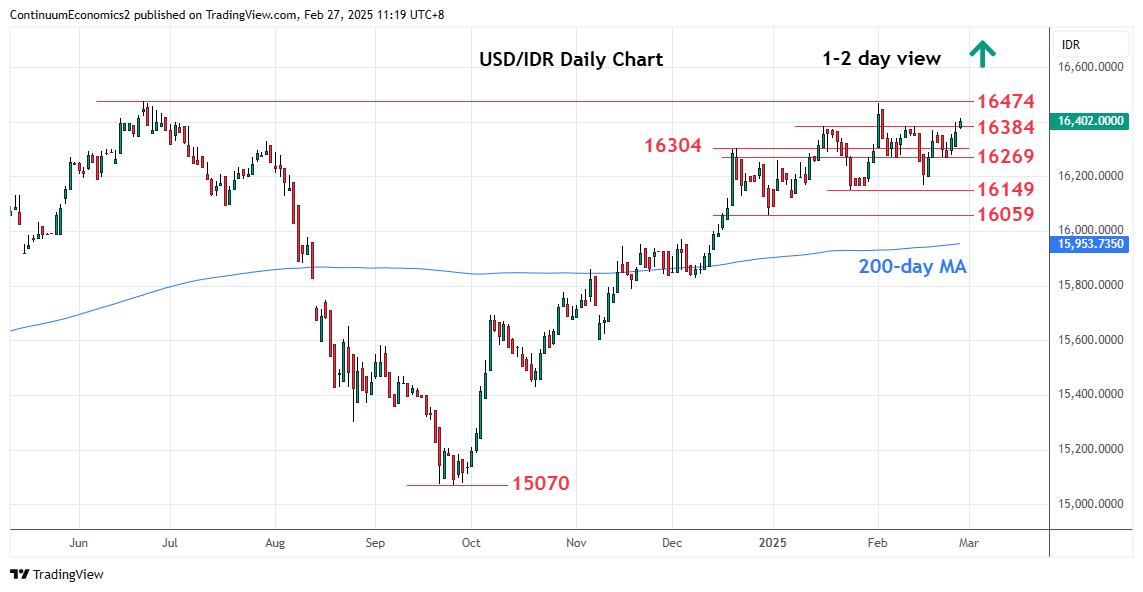
Extending bounce from the 16169 low to reach strong resistance at the 16384/16400 high and congestion area
| Levels | Imp | Comment | Levels | Imp | Comment | |||
|---|---|---|---|---|---|---|---|---|
| R4 | 16600 | * | Mar 2020 high | S1 | 16269 | * | 6 Feb low | |
| R3 | 16474 | ** | Jun 2024 year high | S2 | 16169 | ** | 17 Feb low | |
| R2 | 16470 | ** | 3 Feb YTD high | S3 | 16149 | * | 24 Jan low | |
| R1 | 16400 | ** | figure | S4 | 16059 | * | 31 Dec low |
Asterisk denotes strength of level
03:25 GMT - Extending bounce from the 16169 low to reach strong resistance at the 16384/16400 high and congestion area. Clearance here will open up the 3 February current year high at 16470 and the 2024 year high at 16474 to retest. Beyond these will extend the underlying bull trend from the 2021 year low and see scope to the 16600 level. Meanwhile, support at the 16304/16269 area now underpin. Only break here will expose strong support at the 16169 higher lows to retest. Would take break here to fade the upside pressure and extend pullback from the February high.