Published: 2025-01-21T14:31:08.000Z
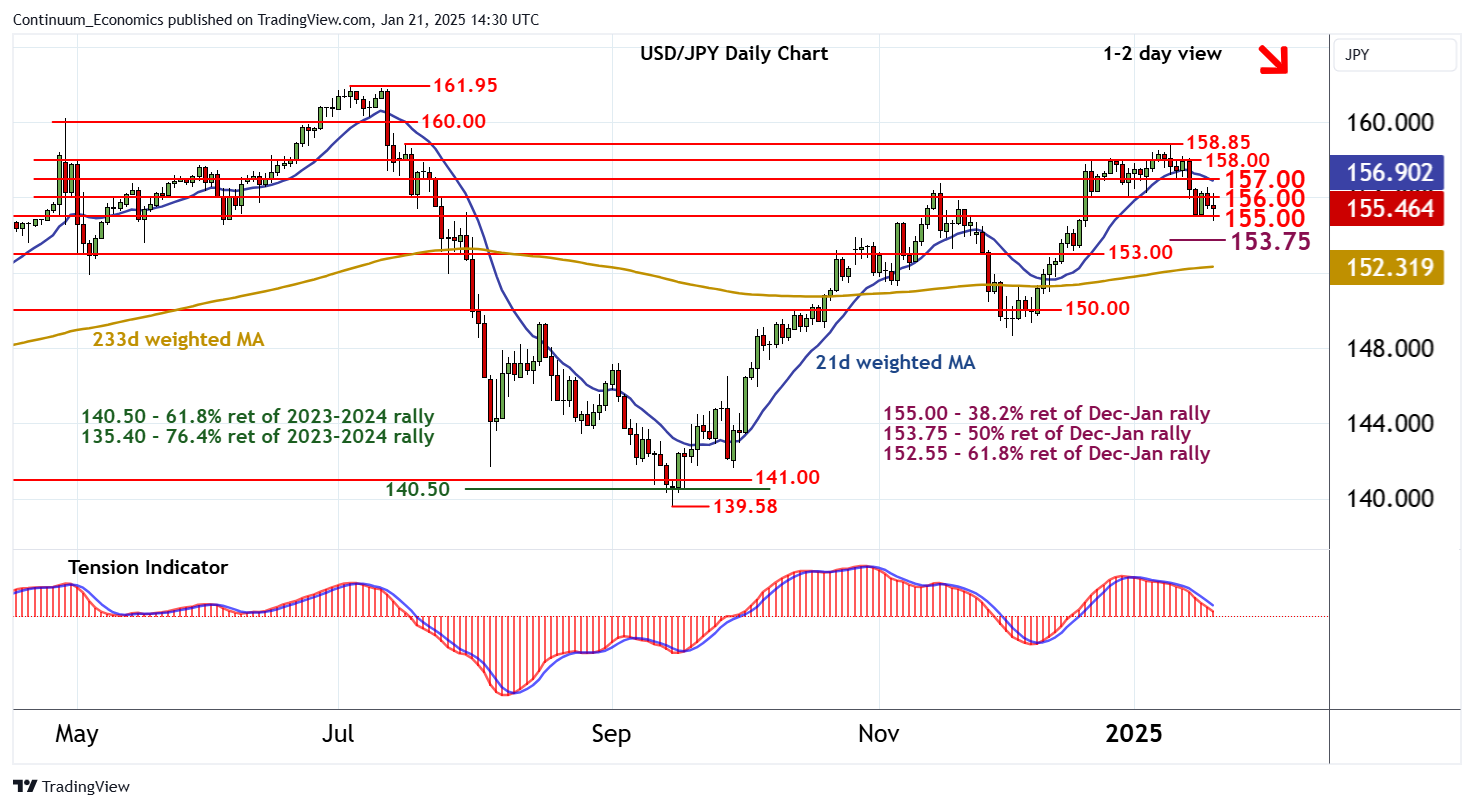
Chart USD/JPY Update: Under pressure

Senior Technical Strategist
1

The anticipated test above 156.00 has been pushed back from 156.25

| Levels | Imp | Comment | Levels | Imp | Comment | |||
|---|---|---|---|---|---|---|---|---|
| R4 | 158.85 | ** | 16 Jul, 10 Jan (w) high | S1 | 155.00 | * | congestion | |
| R3 | 158.00 | * | congestion | S2 | 153.75 | ** | 50% ret of Dec-Jan rally | |
| R2 | 157.00 | * | congestion | S3 | 153.00 | ** | congestion | |
| R1 | 156.00 | * | congestion | S4 | 152.55 | ** | 61.8% ret of Dec-Jan rally |
Asterisk denotes strength of level
14:20 GMT - The anticipated test above 156.00 has been pushed back from 156.25, with prices reaching congestion support at 155.00. Mixed intraday studies and flattening oversold daily stochastics are prompting fresh consolidation around here. But the daily Tension Indicator continues to track lower and weekly charts are deteriorating, pointing to room for a later break beneath here and extension of January losses initially towards the 153.75 Fibonacci retracement. Meanwhile, a close above 156.00, if seen, will help to stabilise price action and give way to consolidation beneath 157.00.