Published: 2026-01-06T14:17:20.000Z
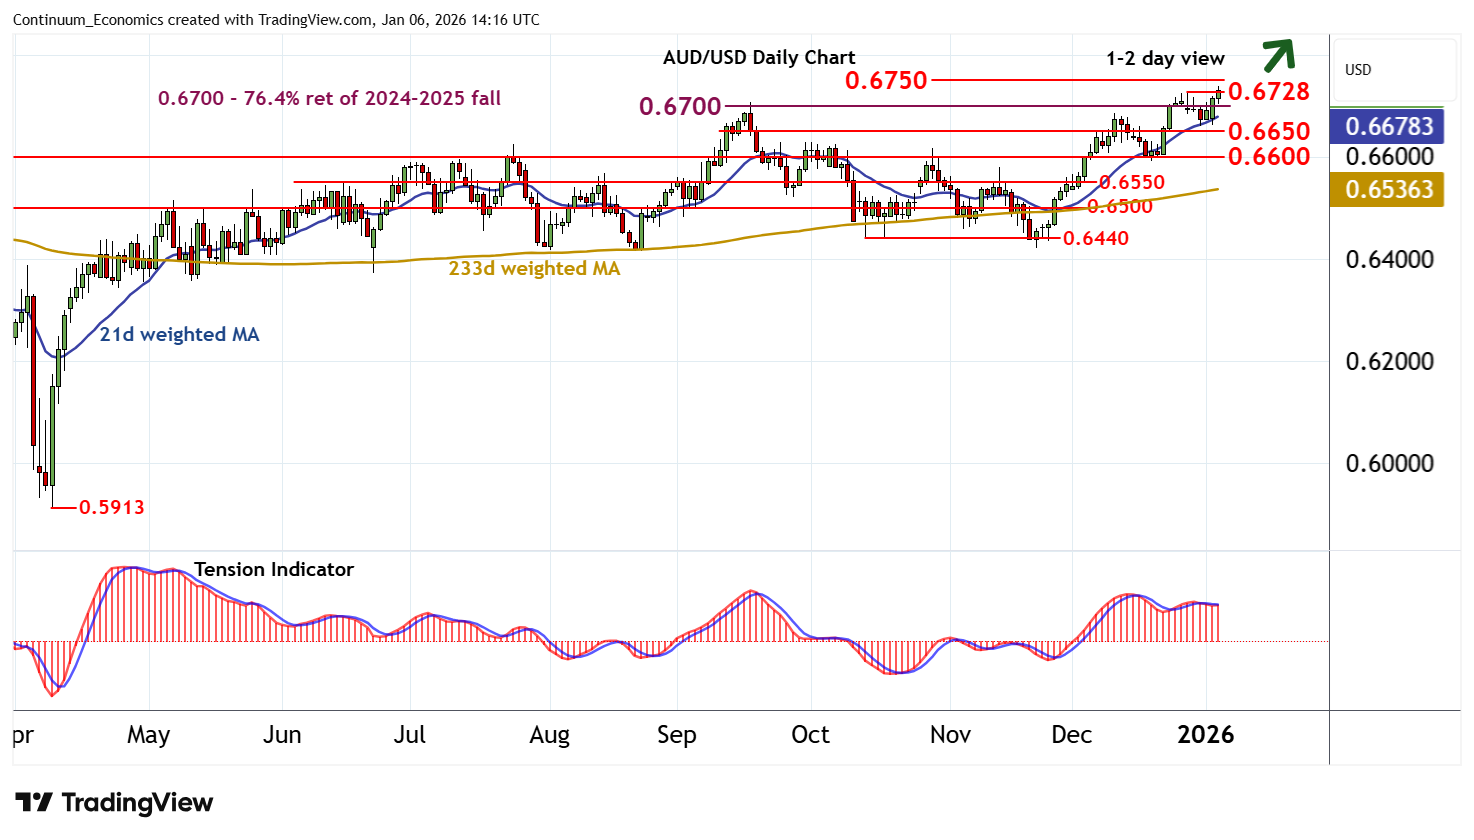
Chart AUD/USD Update: Pressuring 0.6700/28
1
Anticipated minor losses have not been seen
| Levels | Imp | Comment | Levels | Imp | Comment | |||
|---|---|---|---|---|---|---|---|---|
| R4 | 0.6800 | ** | break level | S1 | 0.6650 | congestion | ||
| R3 | 0.6750 | * | congestion | S2 | 0.6600 | ** | congestion | |
| R2 | 0.6728 | * | 29 Dec 2025 (y) high | S3 | 0.6550 | * | congestion | |
| R1 | 0.6700 | ** | 76.4% ret of 2024-2025 fall | S4 | 0.6500 | * | congestion |
Asterisk denotes strength of level
14:05 GMT - Anticipated minor losses have not been seen, as choppy trade gives way to a fresh push higher to test resistance at the 0.6700 Fibonacci retracement and the 0.6728 year high of 29 December 2025. Daily readings have ticked higher and broader weekly charts remain positive, highlighting room for further strength in the coming sessions. A close above here will improve price action and extend April gains towards congestion around 0.6750. Beyond here is 0.6800. Meanwhile, support remains at congestion around 0.6650. A close beneath here, if seen, will help to stabilise price action and prompt consolidation above further congestion around 0.6600.