Chart EUR/USD Update: Daily studies turning down
Anticipated minor gains have not been seen, with prices breaking below 1.1900 to reach support at 1.1838
| Levels | Imp | Comment | Levels | Imp | Comment | |||
|---|---|---|---|---|---|---|---|---|
| R4 | 1.2082 | ** | 27 Jan YTD high | S1 | 1.1838 | * | 4 Feb high | |
| R3 | 1.2000/20 | ** | figure; 38.2% ret | S2 | 1.1800 | * | congestion | |
| R2 | 1.1950 | break level | S3 | 1.1770 | ** | 61.8% ret of January rally | ||
| R1 | 1.1900 | * | congestion | S4 | 1.1750 | ** | congestion |
*Asterisk denotes strength of level
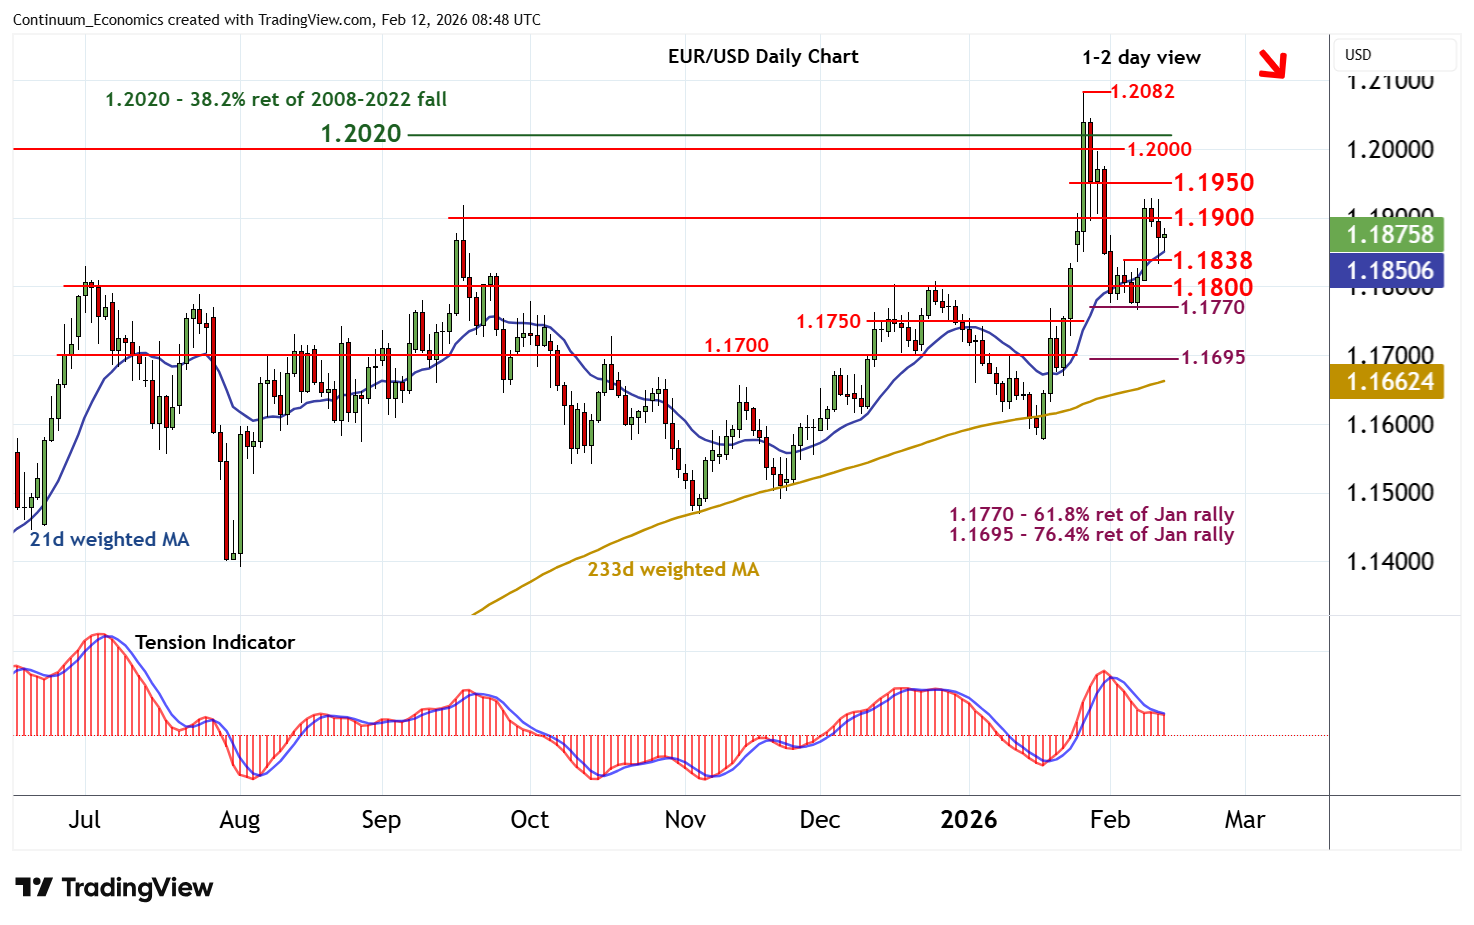
08:40 GMT - Anticipated minor gains have not been seen, with prices breaking below 1.1900 to reach support at 1.1838, before settling into consolidation around 1.1870. Daily stochastics have ticked lower and the flat daily Tension Indicator is also turning down, highlighting room for further losses in the coming sessions. A break below 1.1838 will open up congestion support at 1.1800. But rising weekly charts should limit any immediate tests beneath here in consolidation above the 1.1770 Fibonacci retracement. Meanwhile, resistance is lowered to congestion around 1.1900. A close above here would help to stabilise price action and prompt consolidation beneath 1.1950.