Published: 2026-03-20T02:04:02.000Z
Chart GBP/USD Update: Higher in consolidation
2
Bounce from support at the 1.3250 congestion has seen strong gains to reach the 200-day MA at 1.3435
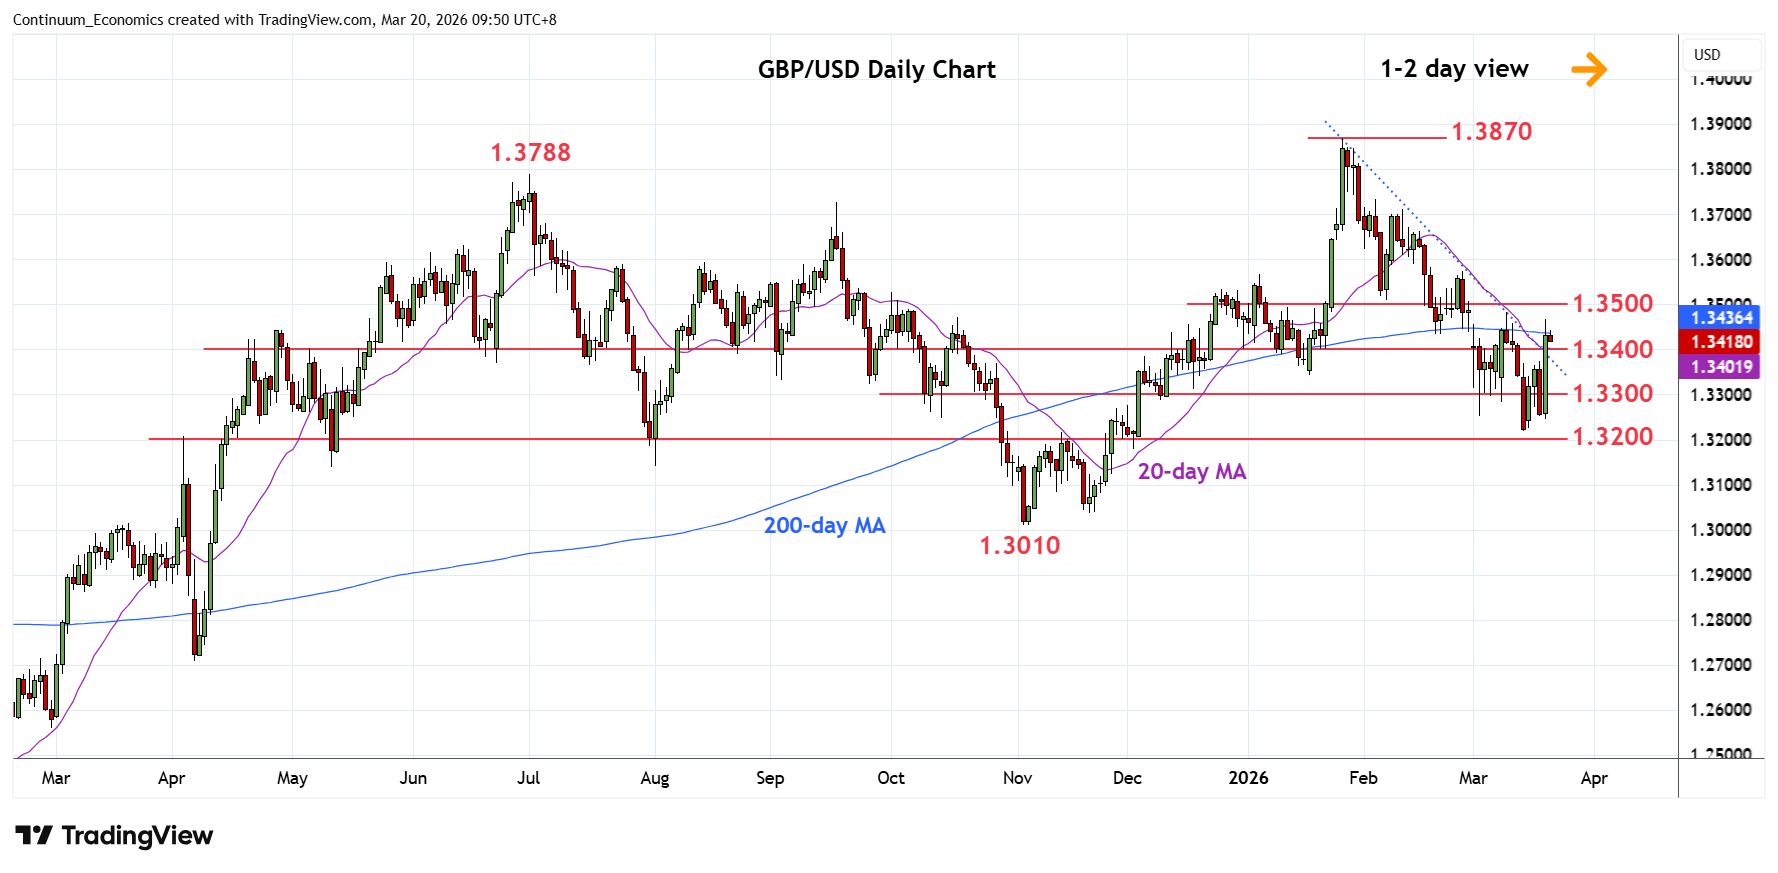
| Level | Comment | Level | Comment | |||||
|---|---|---|---|---|---|---|---|---|
| R4 | 1.3600 | * | congestion | S1 | 1.3350 | * | congestion | |
| R3 | 1.3575 | * | 26 Feb high | S2 | 1.3300 | * | congestion | |
| R2 | 1.3500/10 | ** | congestion, 6 Feb low | S3 | 1.3250 | * | congestion | |
| R1 | 1.3435 | * | 200-day MA | S4 | 1.3213 | ** | 13 Mar YTD low |
Asterisk denotes strength of level
02:00 GMT - Bounce from support at the 1.3250 congestion has seen strong gains above the 1.3400 level to reach the 200-day MA at 1.3435. Above here will see room to strong resistance at the 1.3500/10 congestion and low of 6 February which is expected to cap. Clearance here, will ease the downside pressure and open up room for stronger gains to 1.3575/1.3600 area. Meanwhile, support is raised to the 1.3350/1.3300 congestion area which should now underpin. Only below here will expose the 1.3250 congestion and 1.3213 current year low to retest.