Published: 2026-01-23T07:08:44.000Z
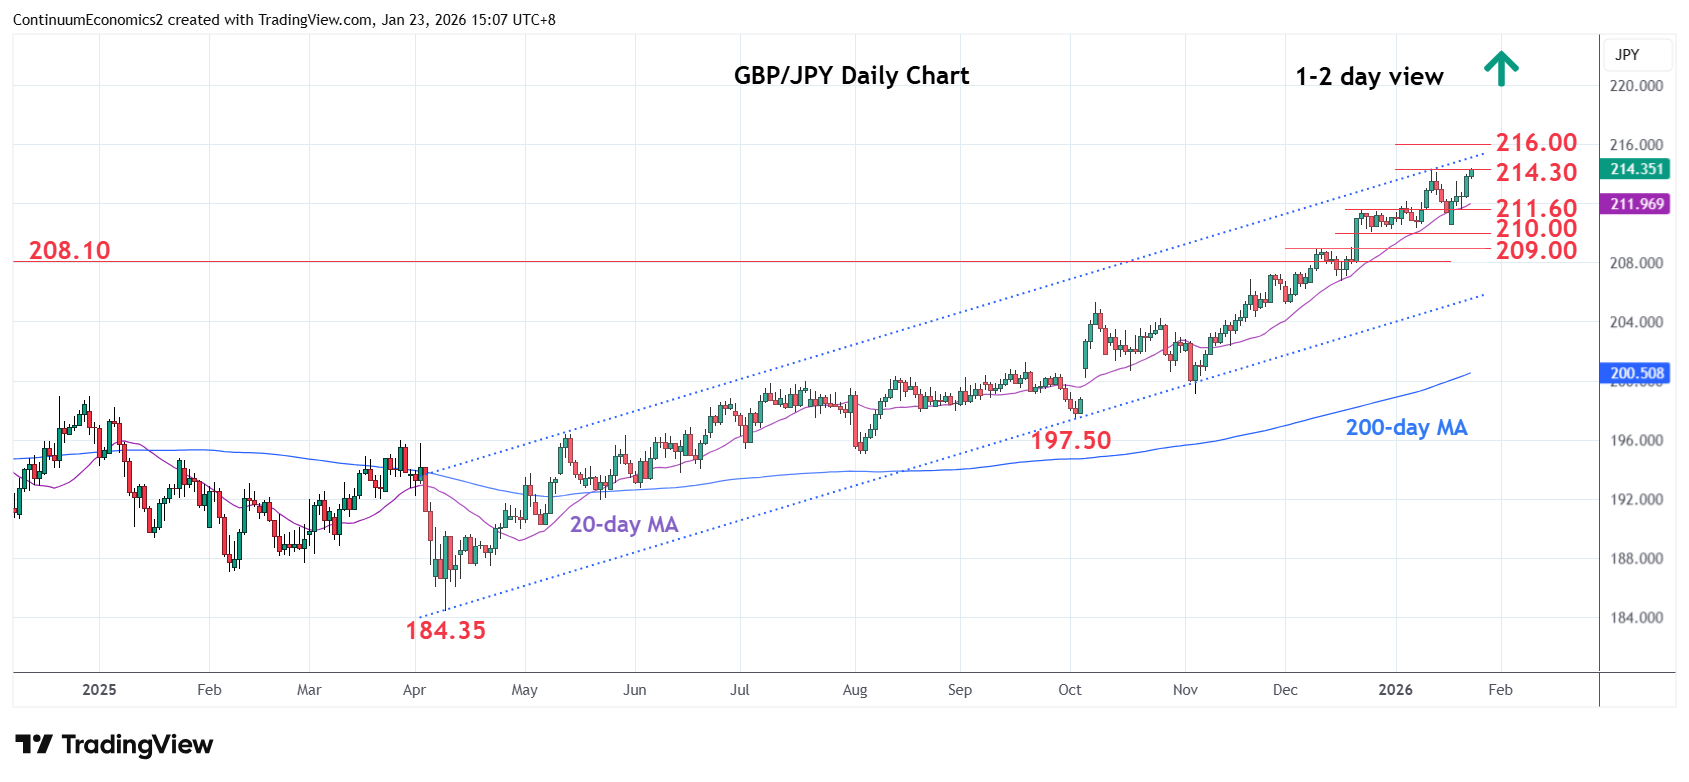
Chart GBP/JPY Update: Pressuring 214.30 high
-
Bounce from the 210.60 low see prices back to retest the 214.30, 13 January current year high
| Levels | Imp | Comment | Levels | Imp | Comment | |||
|---|---|---|---|---|---|---|---|---|
| R4 | 219.30 | ** | Aug 2007 low, 76.4% | S1 | 211.60 | * | 22 Dec high | |
| R3 | 217.30 | * | 8 Jan 2008 high | S2 | 210.60/00 | ** | 19 Jan low, congestion | |
| R2 | 216.00 | ** | Jul 2008 high | S3 | 209.00 | ** | 9 Dec high | |
| R1 | 214.30 | ** | 13 Jan YTD high | S4 | 208.10 | ** | congestion, 2024 year high |
Asterisk denotes strength of level
07:00 GMT - Bounce from the 210.60 low see prices back to retest the 214.30, 13 January current year high. Break here will further extend gains within the bullish channel from the April low and see room to 215.00 upper channel and the 216.00, July 2008 high. Meanwhile, support is raised to the 212.00/211.60, congestion and 22 December high. Would take break of the latter to open up room for deeper pullback to retrace strong gains from the 197.50 October low to the strong support at the 210.60/210.00 congestion area.