Published: 2025-02-26T08:26:52.000Z
Chart GBP/USD Update: Range trade

Senior Technical Strategist
7
Little change, as mixed intraday studies keep near-term sentiment cautious
| Level | Comment | Level | Comment | |||||
|---|---|---|---|---|---|---|---|---|
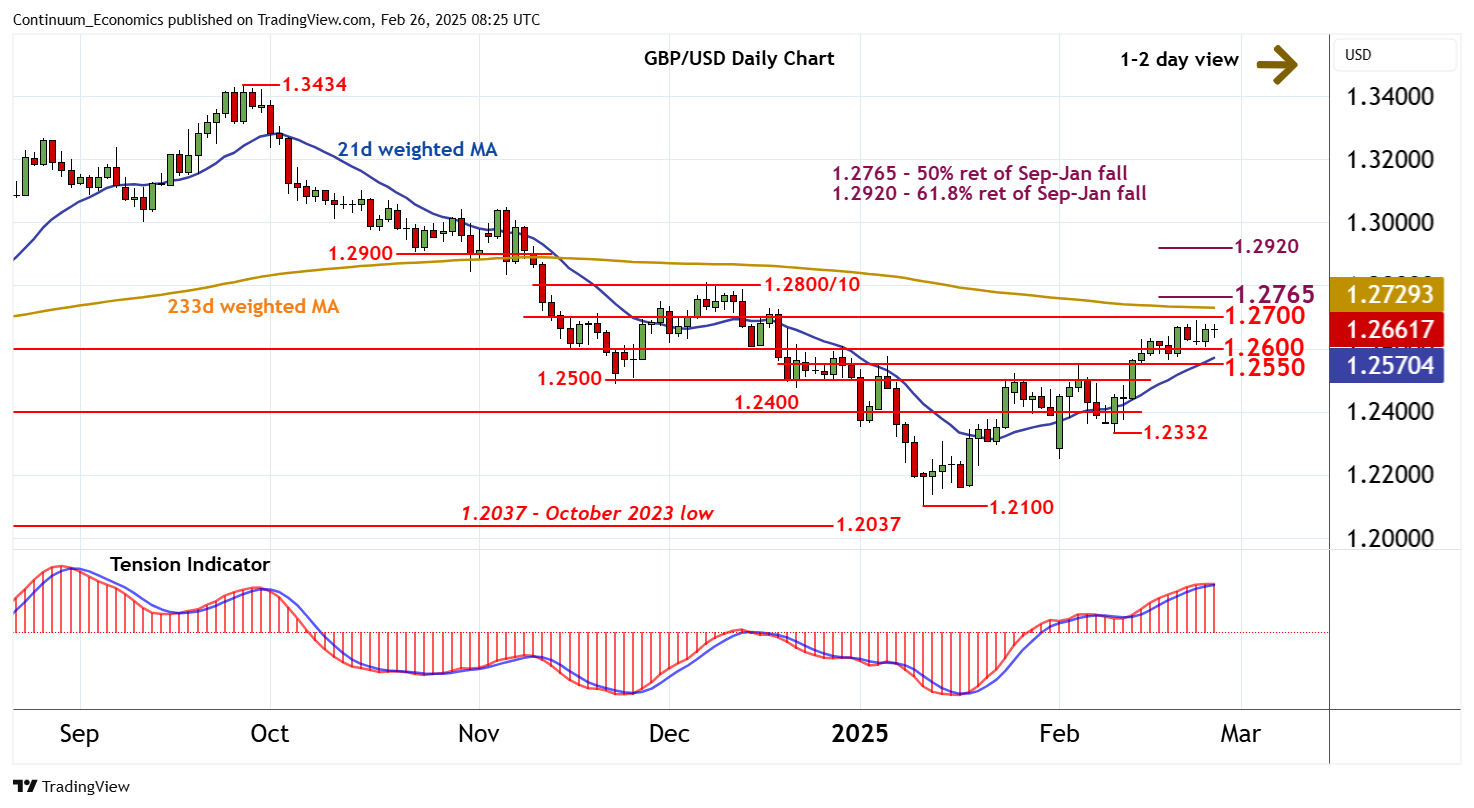
| R4 | 1.2900 | * | break level | S1 | 1.2600 | * | congestion | |
| R3 | 1.2800/10 | ** | congestion; 6 Dec (m) high | S2 | 1.2550 | * | break level | |
| R2 | 1.2765 | ** | 50% ret of Sep-Jan fall | S3 | 1.2500 | * | break level | |
| R1 | 1.2700 | * | congestion | S4 | 1.2450 | break level |
Asterisk denotes strength of level
08:10 GMT - Little change, as mixed intraday studies keep near-term sentiment cautious and extend cautious trade within the 1.2600 - 1.2700 range. Daily readings are also mixed, pointing to extended consolidation, but broader weekly charts are rising, suggesting potential for a later break higher. A close above congestion resistance at 1.2700 will turn sentiment positive and extend January gains initially towards the 1.2765 Fibonacci retracement. Meanwhile, support is at congestion around 1.2600. A break beneath here, if seen, will open up 1.2550, where fresh buying interest is expected to appear.