Published: 2025-09-11T05:20:34.000Z
Chart USD/INR Update: Consolidating below 88.3600, all-time high
0
-
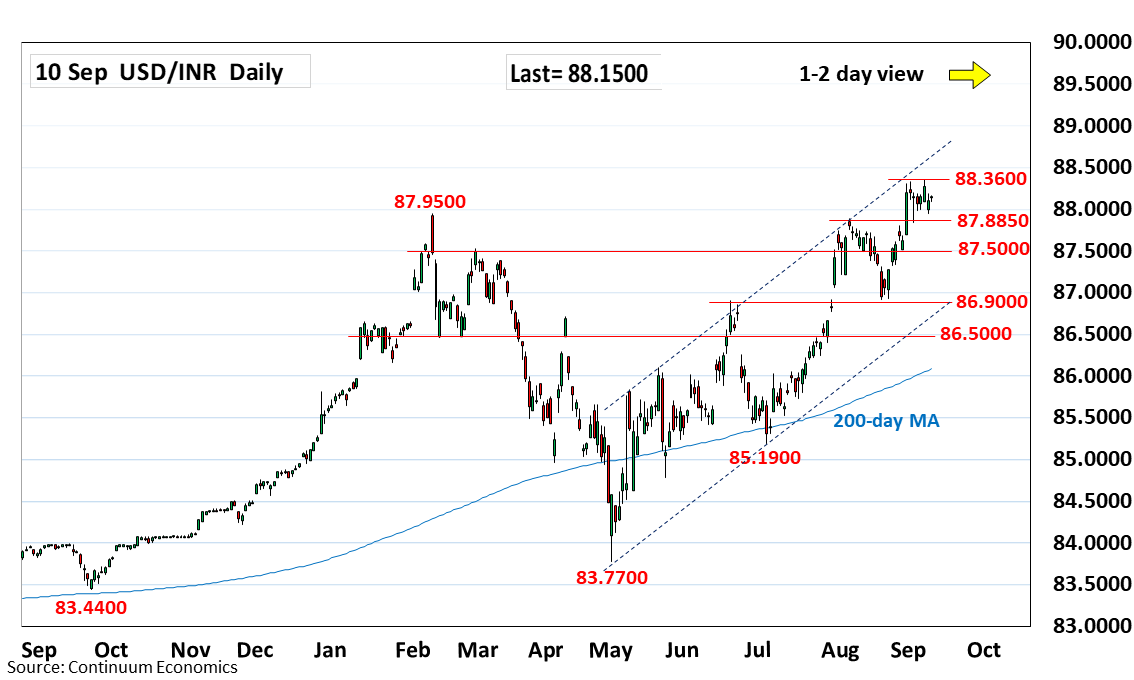
Still little change, as prices extend choppy trade below the 88.3600, all-time high
| Level | Comment | Level | Comment | |||||
|---|---|---|---|---|---|---|---|---|
| R4 | 88.7000 | * | projection | S1 | 88.0000 | * | figure | |
| R3 | 88.6500 | * | upper channel | S2 | 87.8850 | ** | 5 Aug high | |
| R2 | 88.5000 | ** | figure | S3 | 87.5000 | * | congestion | |
| R1 | 88.3600 | ** | 5 Sep all-time high | S4 | 87.0000 | * | figure |
Asterisk denotes strength of level
05:15 GMT - Still little change, as prices extend choppy trade below the 88.3600, all-time high. The resulting flag pattern suggest potential for break to further extend gains from the 83.7700, May current year low. Clearance will see room to target the 88.5000 level and 88.6500, upper channel. Meanwhile, support at the 88.0000 level and 87.8850 high of 5 August, should limit corrective pullback. Would take break here fade the upside pressure and open up room for deeper correction to the strong gains from the 88.1900, July low.