Published: 2026-04-22T01:41:23.000Z
Chart GBP/USD Update: Consolidating at 1.3500 level
1
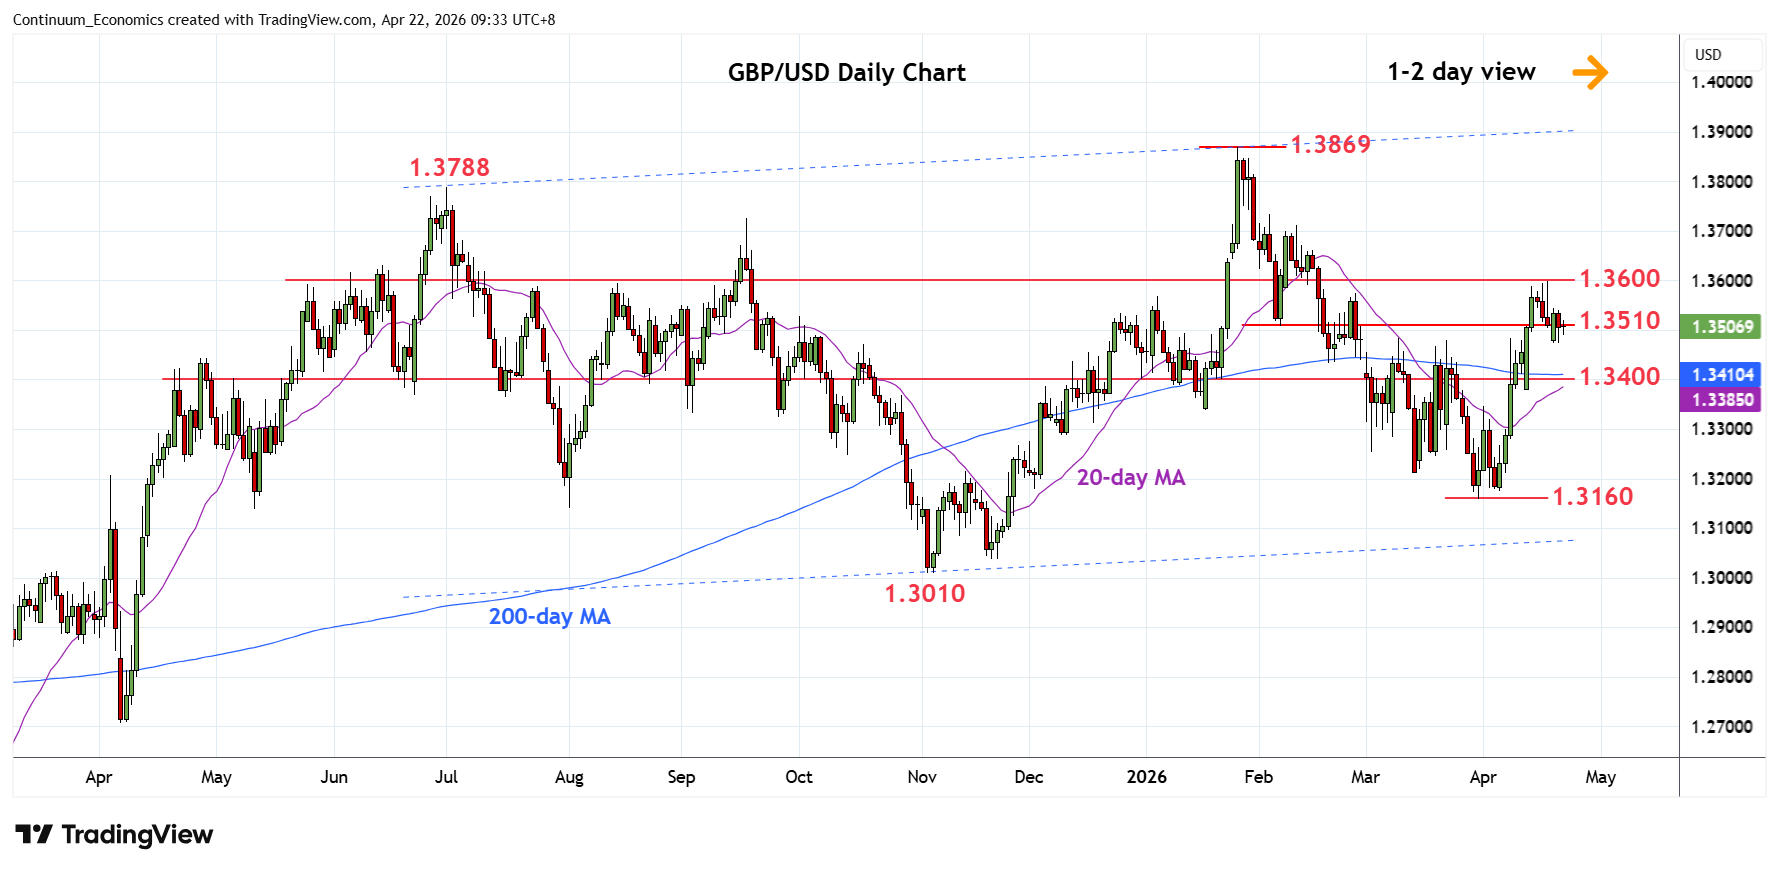
Back in consolidation at the 1.3500 level following bounce from support at 1.3480, March high
| Level | Comment | Level | Comment | |||||
|---|---|---|---|---|---|---|---|---|
| R4 | 1.3788 | ** | Jul 2025 yr high | S1 | 1.3510/00 | * | 6 Feb low, congestion | |
| R3 | 1.3700 | * | congestion, 76.4% | S2 | 1.3480 | * | March high | |
| R2 | 1.3650 | * | congestion | S3 | 1.3400 | * | congestion | |
| R1 | 1.3600 | * | 61.8% Jan/Mar fall | S4 | 1.3380 | ** | 13 Apr low |
Asterisk denotes strength of level
01:35 GMT - Back in consolidation at the 1.3500 level following bounce from support at 1.3480, March high. A deeper corrective pullback from the 1.3600 level cannot be ruled out to retrace gains from the 1.3160 March low to support at the 1.3400 congestion. However, corrective pullback are expected to give way to renewed buying interest later. A later break above the 1.3600 level will further retrace the January/March losses and see room to 1.3650/1.3700 area. Beyond this will return focus to 1.3788 and 1.3869, 2025 year high and January YTD high.