Chart GBP/USD Update: Leaning lower

Cautious trade is giving way to a drift lower
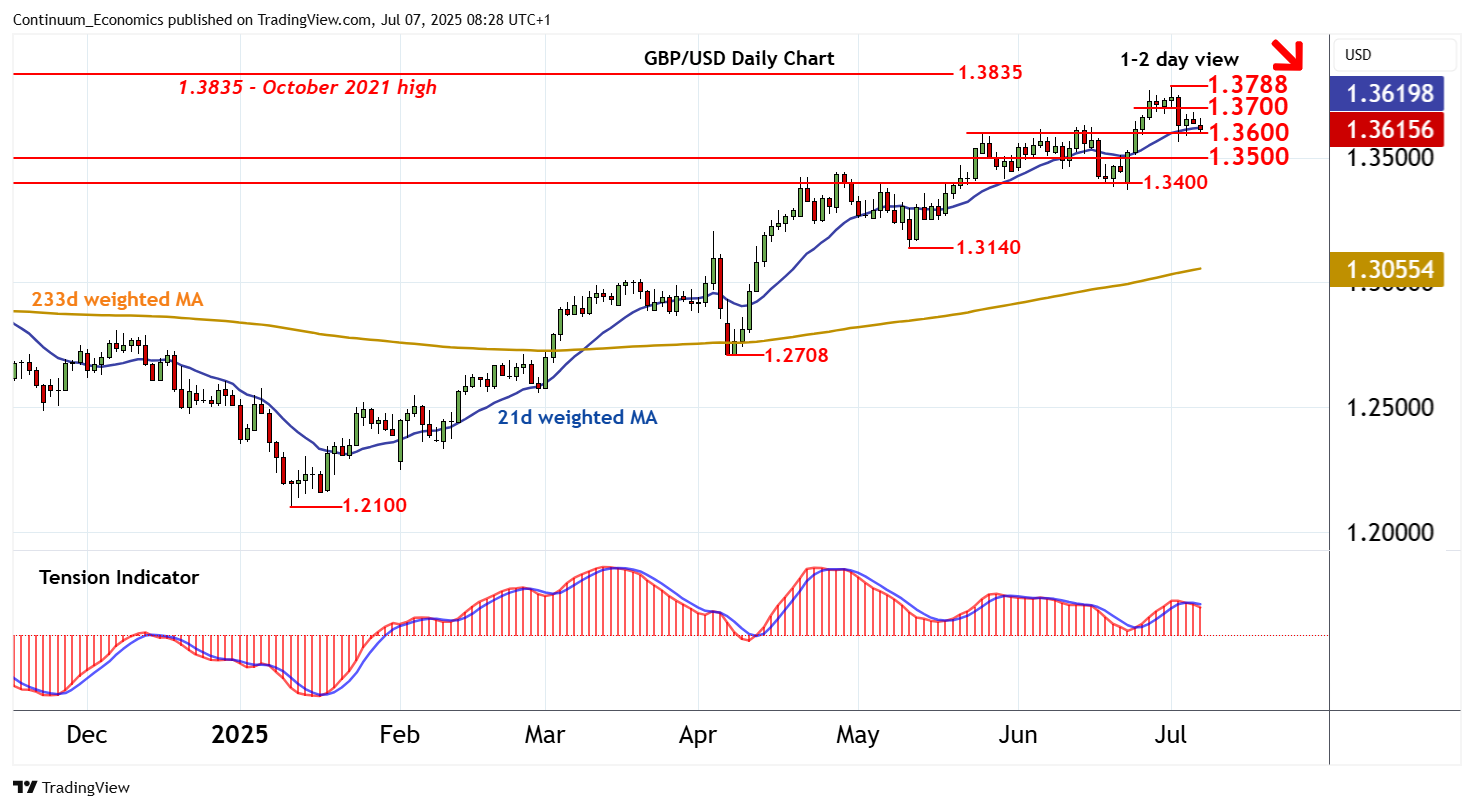
| Level | Comment | Level | Comment | |||||
|---|---|---|---|---|---|---|---|---|
| R4 | 1.3835 | * | October 2021 high | S1 | 1.3600 | * | congestion | |
| R3 | 1.3800 | * | break level | S2 | 1.3500 | ** | congestion | |
| R2 | 1.3788 | ** | 1 Jul YTD high | S3 | 1.3400 | * | congestion | |
| R1 | 1.3700 | break level | S4 | 1.3370 | * | 23 Jun (m) low |
Asterisk denotes strength of level
08:10 BST - Cautious trade is giving way to a drift lower, as intraday studies turn down, with prices currently consolidating the test of congestion support at 1.3600. Daily readings continue to track lower and weekly charts are deteriorating, highlighting room for further losses in the coming sessions. A break below 1.3600 will open up congestion around 1.3500. However, rising longer-term charts should limit any deeper losses in renewed buying interest above 1.3400. Meanwhile, resistance remains at 1.3700. A close above here, not yet seen, will turn sentiment cautious. But a further close above the 1.3788 current year high of 1 July is needed to turn price action positive and extend September 2022 gains initially to the 1.3835 high of October 2021.