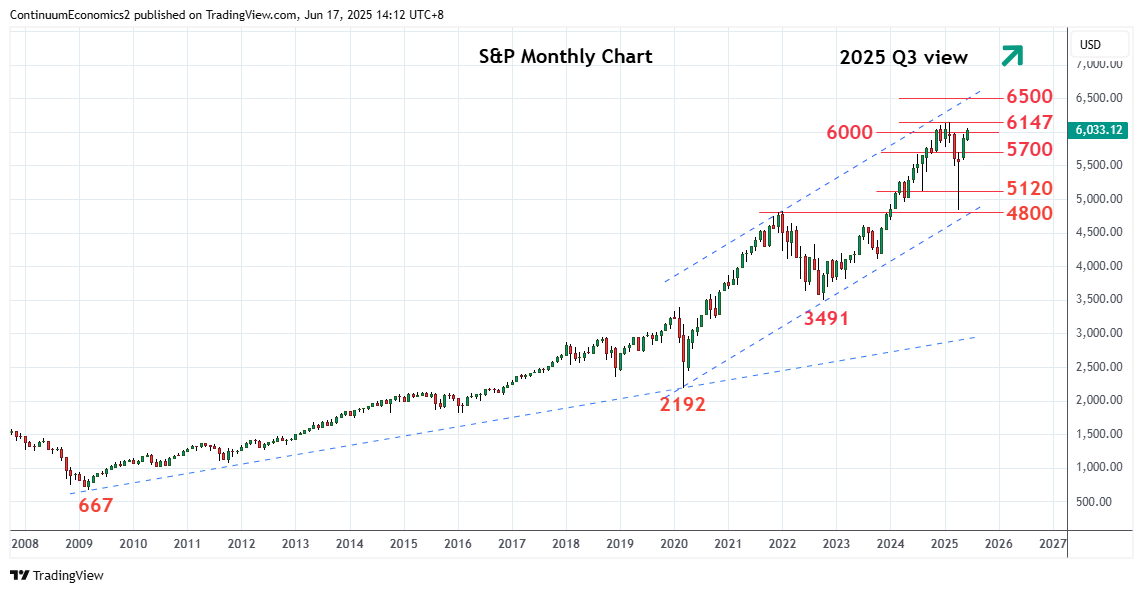
Chartbook: U.S. Chart S&P 500: Extending gains within a 5-year bull channel
Met with selling pressure from the February all-time high at 6147 with prices falling sharply before stabilizing in early-Q2 at 4835 low
Met with selling pressure from the February all-time high at 6147 with prices falling sharply before stabilizing in early-Q2 at 4835 low, just above critical support at the 4800 level and channel support from 2020 year low.
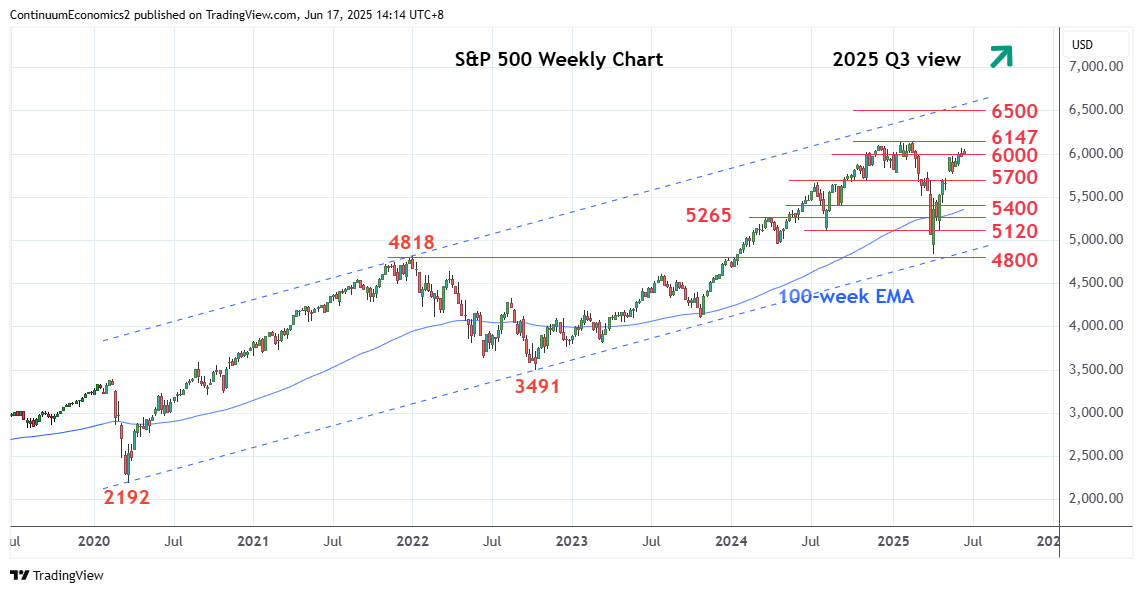
Sharp rally from the latter has seen gains to regain 6000 but falling just shy of 6100/6147, the 2024 year high and February record high. The resulting wedge pattern and overbought weekly studies suggest consolidation likely before scope for fresh strength to retest latter. Break here, if seen, will further extend gains within the 5-year bull channel from the February 2020 low and see room for extension to 6500/6600, the upper channel area going into Q3/Q4 2025
Meanwhile, support at the 5800/5700 gap area from early-May is expected to underpin. However, overbought weekly studies highlights risk for break here to open up room for deeper pullback to support at the 5500/5400 congestion area. Failure to hold this will see room for further slide to lower support at 5120 and the 5000 figure.