Chart USD/CAD Update: Leaning lower
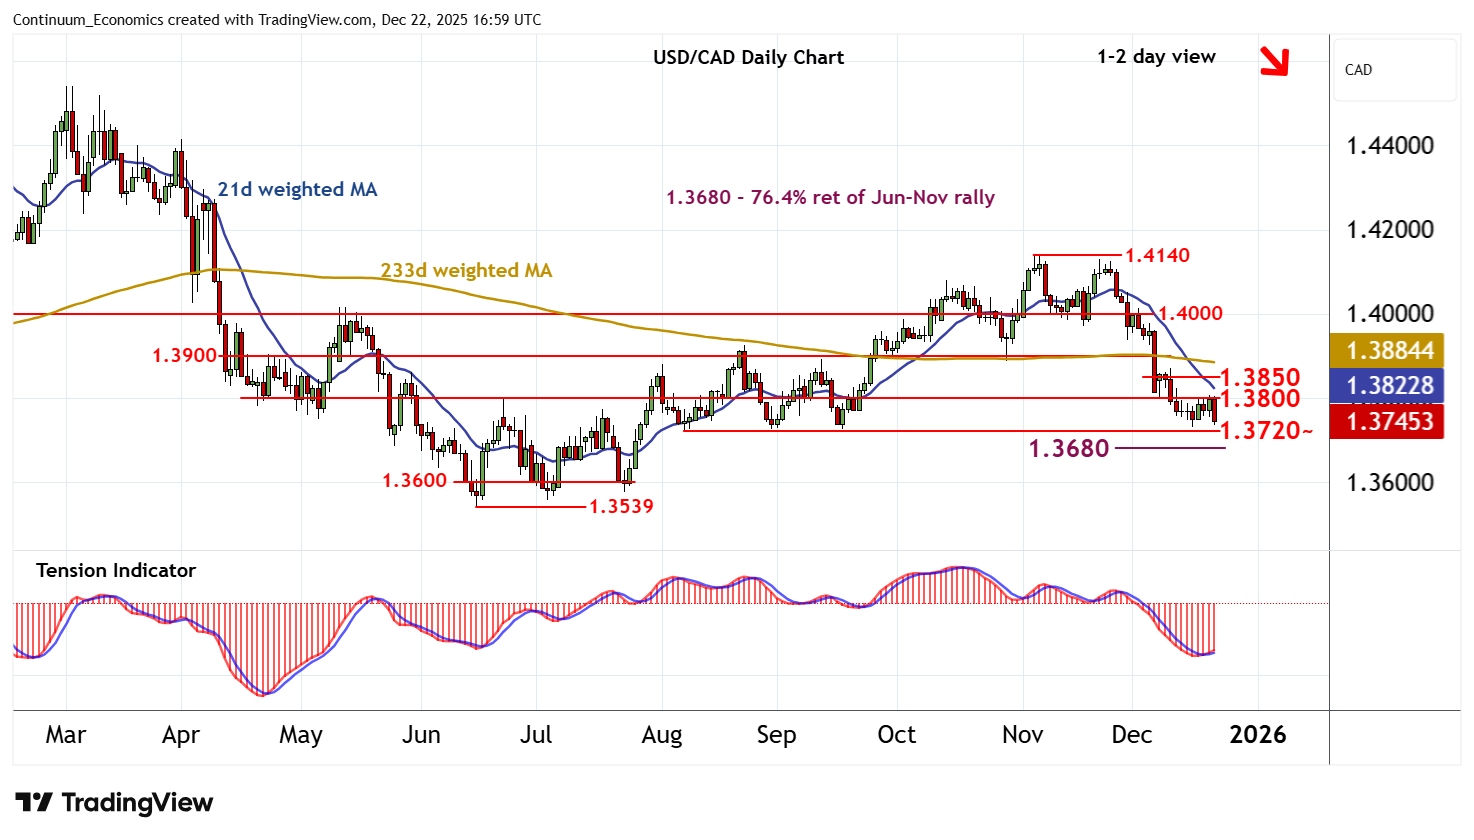
Consolidation beneath congestion resistance at 1.3800 is giving way to the anticipated pullback
| Levels | Imp | Comment | Levels | Imp | Comment | |||
|---|---|---|---|---|---|---|---|---|
| R4 | 1.3950 | * | break level | S1 | 1.3720~ | ** | Aug-Sep lows | |
| R3 | 1.3900 | ** | break level | S2 | 1.3680 | ** | 76.4% ret of Jun-Nov rally | |
| R2 | 1.3850 | congestion | S3 | 1.3600 | * | congestion | ||
| R1 | 1.3800 | ** | congestion | S4 | 1.3539 | ** | 16 Jun YTD low |
Asterisk denotes strength of level
16:30 GMT - Consolidation beneath congestion resistance at 1.3800 is giving way to the anticipated pullback, with focus turning to support at the 1.3720~ lows from August-September. Negative intraday studies highlight room for a test beneath here. But mixed daily readings are expected to limit initial scope in fresh consolidation above the 1.3680 Fibonacci retracement, before bearish weekly charts prompt further losses. A close beneath here will add weight to sentiment and extend November losses towards congestion around 1.3600. Meanwhile, a close above 1.3800, if seen, will open up further congestion around 1.3850, where fresh consolidation is expected to appear.