Published: 2025-12-17T00:31:39.000Z
Chart NZD/USD Update: Leaning lower from the .5830 high
-
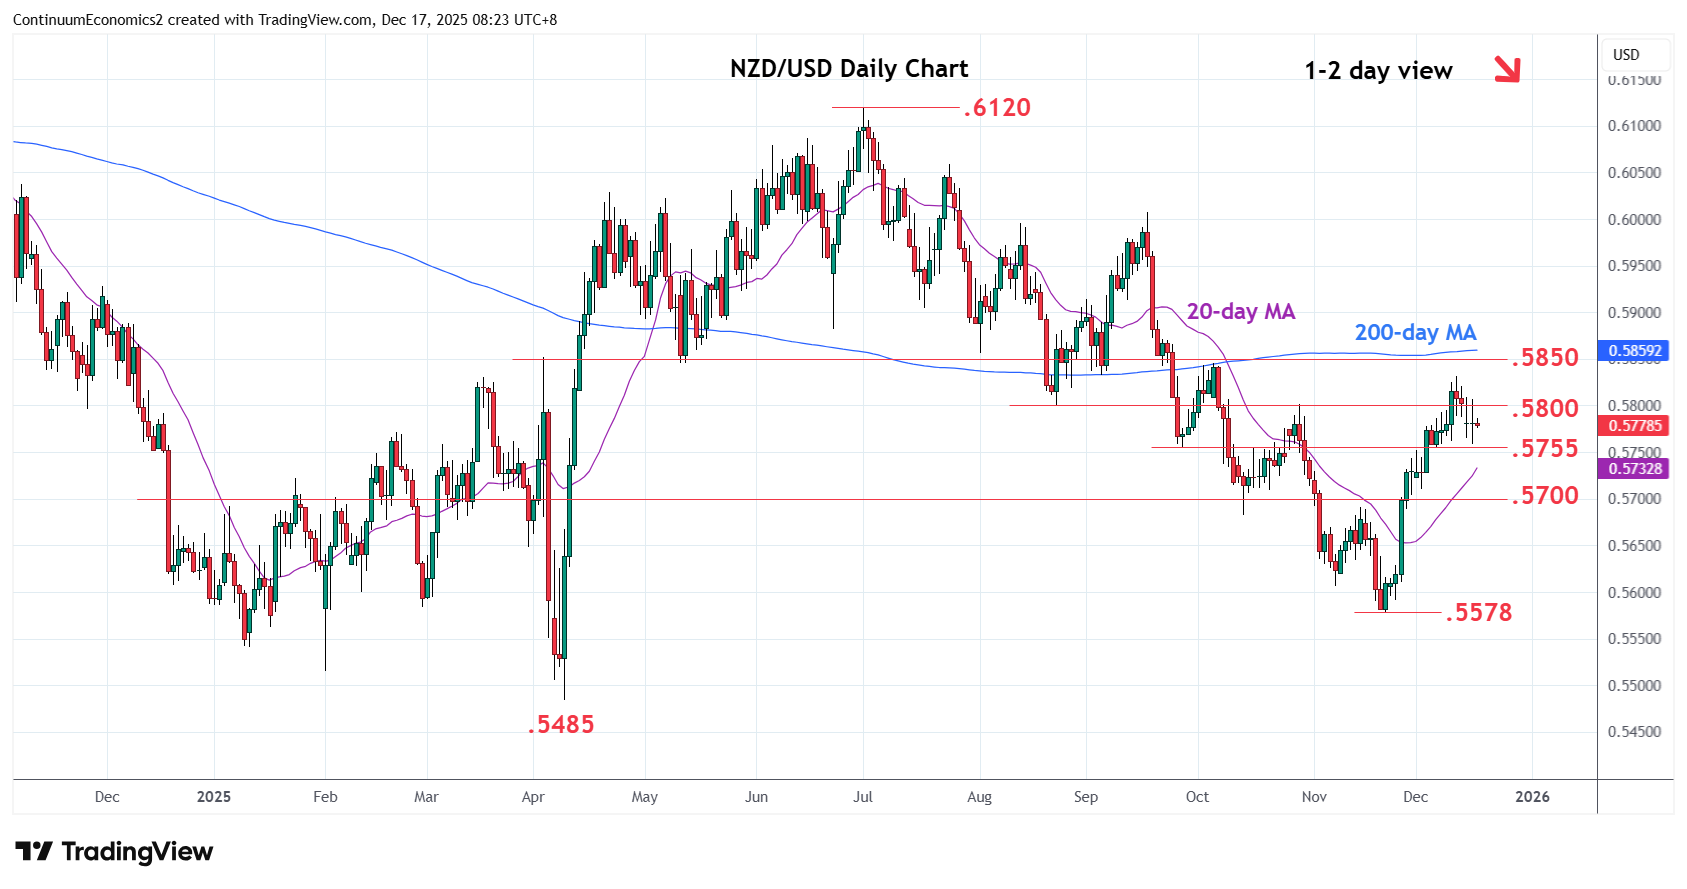
Edging lower from the .5830 high but prices still supported above the .5755/50 area
| Levels | Imp | Comment | Levels | Imp | Comment | |||
|---|---|---|---|---|---|---|---|---|
| R4 | .5950 | * | congestion | S1 | .5755/50 | * | Sep low, congestion | |
| R3 | .5910 | * | 61.8% Jul/Nov fall | S2 | .5700/.5682 | ** | congestion, Oct low | |
| R2 | .5850/55 | ** | 50%, 1 Aug low | S3 | .5650 | * | congestion | |
| R1 | .5830 | * | 11 Dec high | S4 | .5606 | 7 Nov low |
Asterisk denotes strength of level
00:25 GMT - Edging lower from the .5830 high but prices still supported above the .5755/50 area. Daily studies are unwinding overbought readings and suggest potential for break here to retrace rally from the .5578 November low. Lower will see room to the .5700 level. Corrective pullback are expected to give way to renewed buying interest later. Break above the .5830 high will see room for extension to strong resistance at the .5850/55, 50% Fibonacci level and 1st August low. Clearance here will further retrace losses from the .6120 July high to the .5910, 61.8% Fibonacci level.