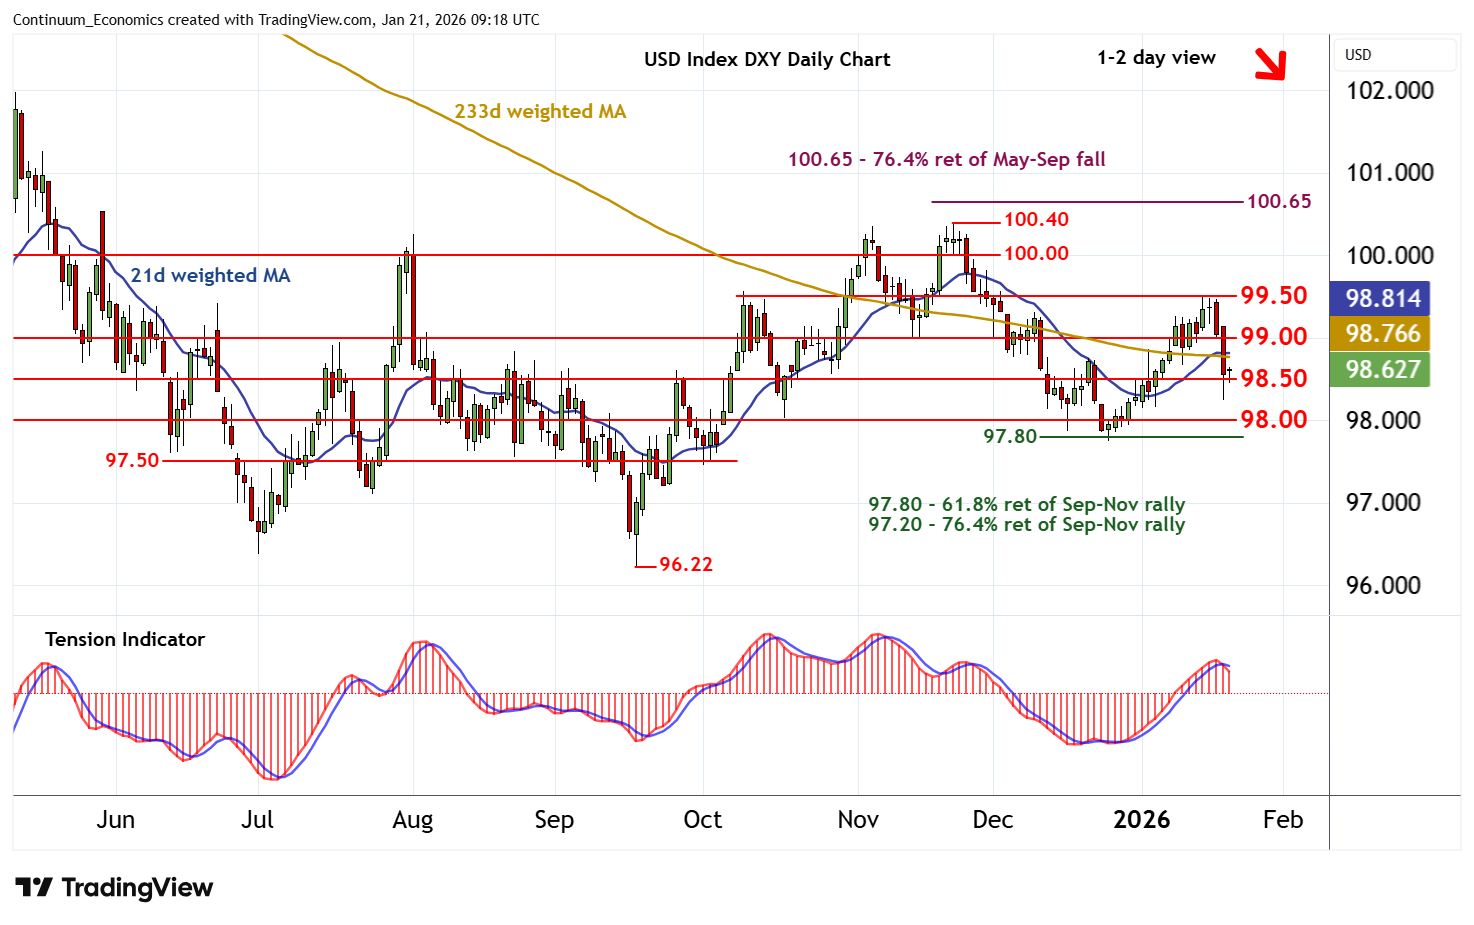
Chart USD Index DXY Update: Consolidating - daily studies under pressure
Little change, as the sharp bounce from the 98.25 low of 20 January gives way to extended consolidation around 98.65
| Levels | Imp | Comment | Levels | Imp | Comment | |||
|---|---|---|---|---|---|---|---|---|
| R4 | 100.40 | ** | 21 Nov (m) high | S1 | 98.50 | * | congestion | |
| R3 | 100.00 | ** | congestion | S2 | 98.25 | 20 Jan low | ||
| R2 | 99.50 | * | break level | S3 | 98.00 | * | congestion | |
| R1 | 99.00 | * | congestion | S4 | 97.80 | ** | 61.8% ret of Sep-Nov rally |
Asterisk denotes strength of level
09:10 GMT - Little change, as the sharp bounce from the 98.25 low of 20 January gives way to extended consolidation around 98.65. Daily stochastics are falling and the daily Tension Indicator has turned bearish, highlighting room for fresh tests lower in the coming sessions. A break below congestion support at 98.50 will open up 98.25. But mixed weekly charts should limit any initial continuation beneath here in consolidation above strong support at congestion around 98.00 and the 97.80 Fibonacci retracement. Meanwhile, resistance remains at congestion around 99.00. A close above here, if seen, will help to stabilise price action and give way to consolidation beneath 99.50.