Published: 2025-09-12T03:11:12.000Z
Chart USD/MYR Update: Lower highs weighing on 4.2000 level
0
-
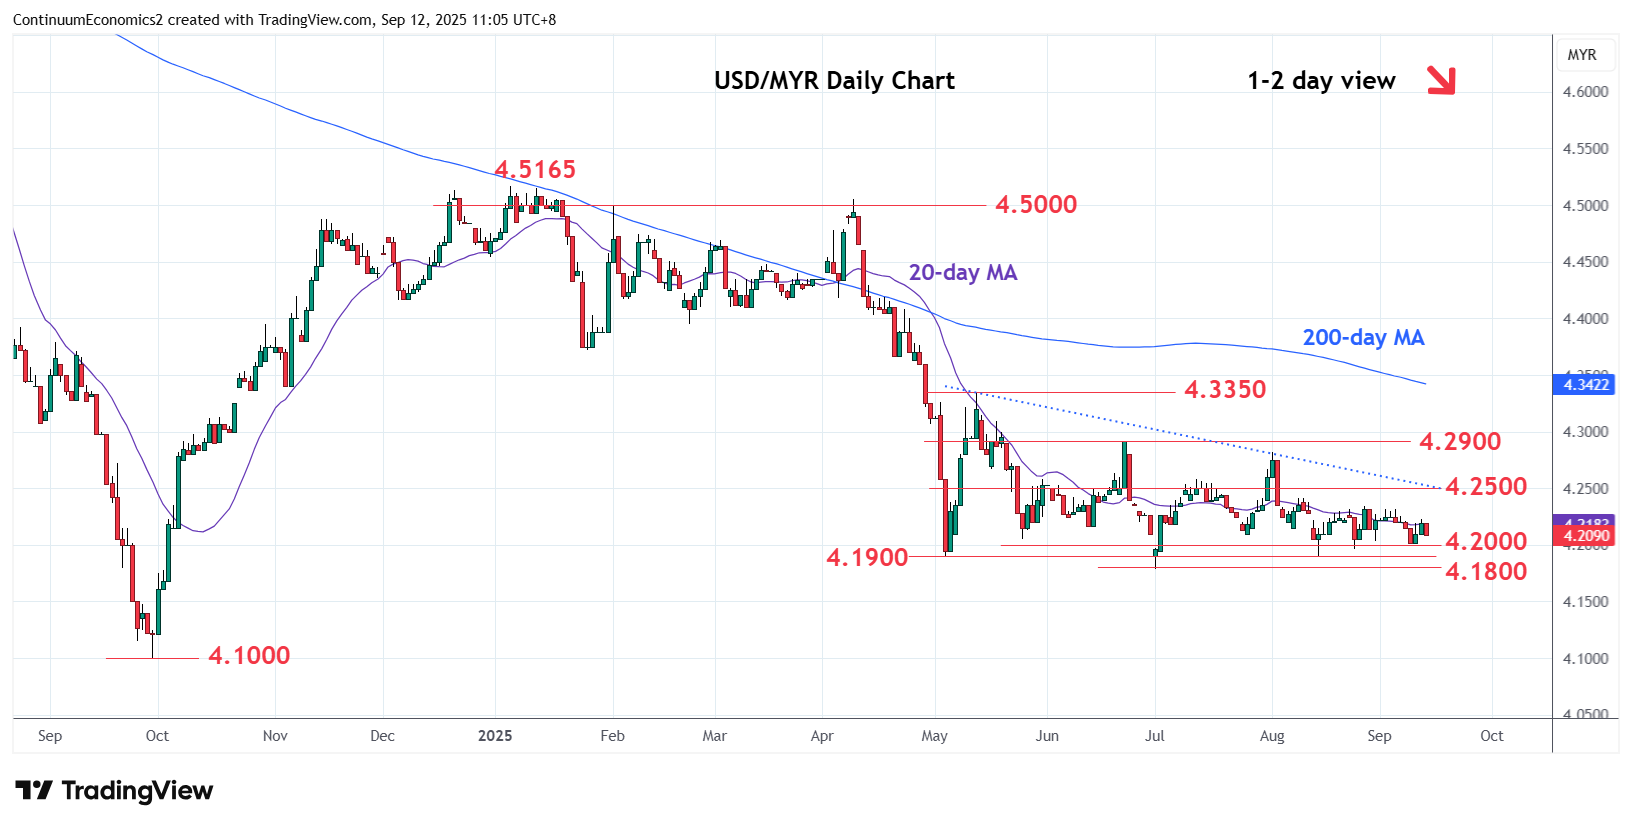
Little change, as prices extend consolidation above the 4.2000 level
| Levels | Imp | Comment | Levels | Imp | Comment | |||
|---|---|---|---|---|---|---|---|---|
| R4 | 4.2820 | ** | 1 Aug high | S1 | 4.2000 | * | congestion | |
| R3 | 4.2500 | * | congestion | S2 | 4.1900 | * | May low | |
| R2 | 4.2400 | * | 8 Aug high | S3 | 4.1800 | ** | 1 Jul YTD low | |
| R1 | 4.2340 | * | 27 Aug high | S4 | 4.1500 | * | congestion |
Asterisk denotes strength of level
03:10 GMT - Little change, as prices extend consolidation above the 4.2000 level. However, lower highs from the 4.2340/4.2400 area keeps pressure on the downside and suggest ranging action to give way to fresh selling pressure later. Descending traingle from the May high threatens break of the 4.2000 level and the 4.1900/4.1800, May/July lows, to extend losses from the January high and see extension to the 4.1500 congestion and 4.1250 support. Meanwhile, resistance at 4.2340/4.2400 area is expected to cap.