Continuum Economics
  • Search
  • About Us
  • Buy
  • Invite A Friend
  • My Basket
  • Articles
  • Calendar
  • Forecasts
  • Events
  • Data
  • Newsletters
  • My Alerts
  • Community
  • Directory
  • About Us
  • Buy
  • Invite A Friend
  • My Basket
  • Articles
    • All
    • Thematic
    • Tactical
    • Asia
    • EMEA
    • Americas
    • Newsletters
    • Freemium
    • Editor's Choice
    • Most Viewed
    • Most Shared
    • Most Liked
  • Calendar
    • Interactive
      • China
      • United States
      • Eurozone
      • United Kingdom
    • Month Ahead
    • Reviews
    • Previews
  • Forecasts
    • Forecasts
    • Key Views
  • Events
    • Media
    • Conference Calls
  • Data
    • Country Insights
    • Shadow Credit Ratings
    • Full CI Data Download
  • Newsletters
  • My Alerts
  • Community
    • FX
    • Fixed Income
    • Macro Strategy
    • Credit Markets
    • Equities
    • Commodities
    • Precious Metals
    • Renewables
  • Directory
  • My Account
  • Notifications Setup
  • Administration Panel
  • Account Details
  • Recent Devices
  • Distribution Lists
  • Shared Free Trials
  • Saved Articles
  • Shared Alerts
  • My Posts
Published: 2025-10-30T14:49:00.000Z

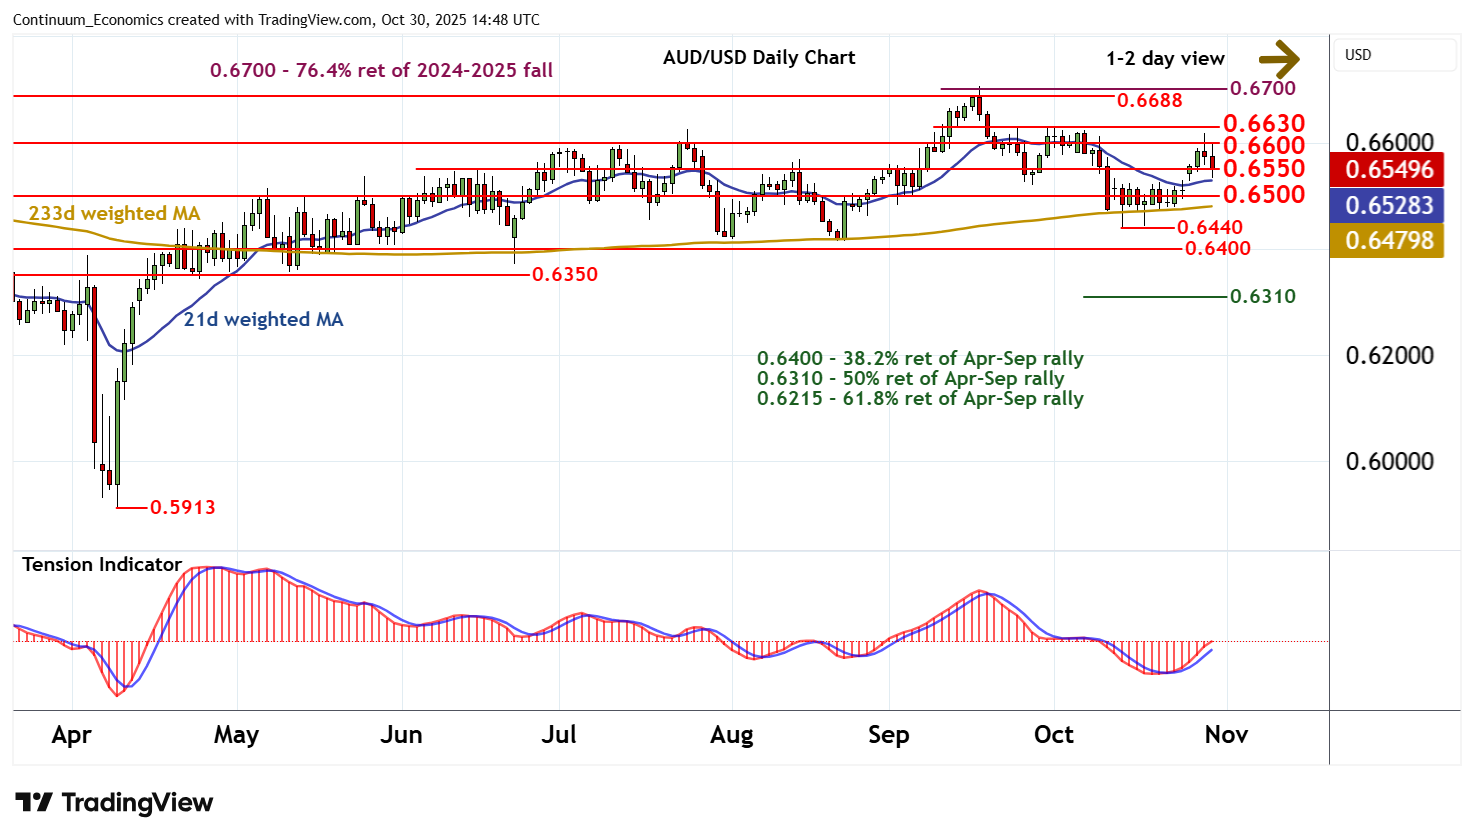
Chart AUD/USD Update: Limited downside tests

2

Consolidation following the test of resistance at congestion around 0.6600 and the 0.6630 break level is giving way to a pullback

 LevelsImpComment  LevelsImpComment
R40.6700**76.4% ret of 2024-2025 fall S10.6550*congestion
R30.6688*7 Nov 2024 (m) high S20.6500*congestion
R20.6630*break level S30.6440*14 Oct (w) low
R10.6600**congestion S40.6400**congestion

Asterisk denotes strength of level

14:30 GMT - Consolidation following the test of resistance at congestion around 0.6600 and the 0.6630 break level is giving way to a pullback, as intraday studies turn down, with prices currently trading around congestion support at 0.6550. Overbought daily stochastics are turning down, highlighting room for a fresh test beneath here. But the rising daily Tension Indicator and mixed/positive weekly charts are expected to limit scope in renewed buying interest above further congestion around 0.6500. Meanwhile, a close above 0.6630 is needed to turn sentiment positive and extend mid-October gains towards critical resistance at the 0.6688 monthly high of November 2024 and the 0.6700 Fibonacci retracement.

Continue to read the article for free
Login

or

or

Topics
AUD/USD-TA
DM-Technical
Technical Analysis

GENERAL

  • Home
  • About Us
  • Our Team
  • Careers

LEGAL

  • Terms and Conditions
  • Privacy Policy
  • Compliance
  • GDPR

GET IN TOUCH

  • Contact Us
Continuum Economics
The Technical Analyst Awards Winner 2021
The Technical Analyst Awards Finalist 2020
image