Published: 2025-06-30T02:38:32.000Z
Chart USD/KRW Update: Consolidating, but still heavy

Technical Analyst
1
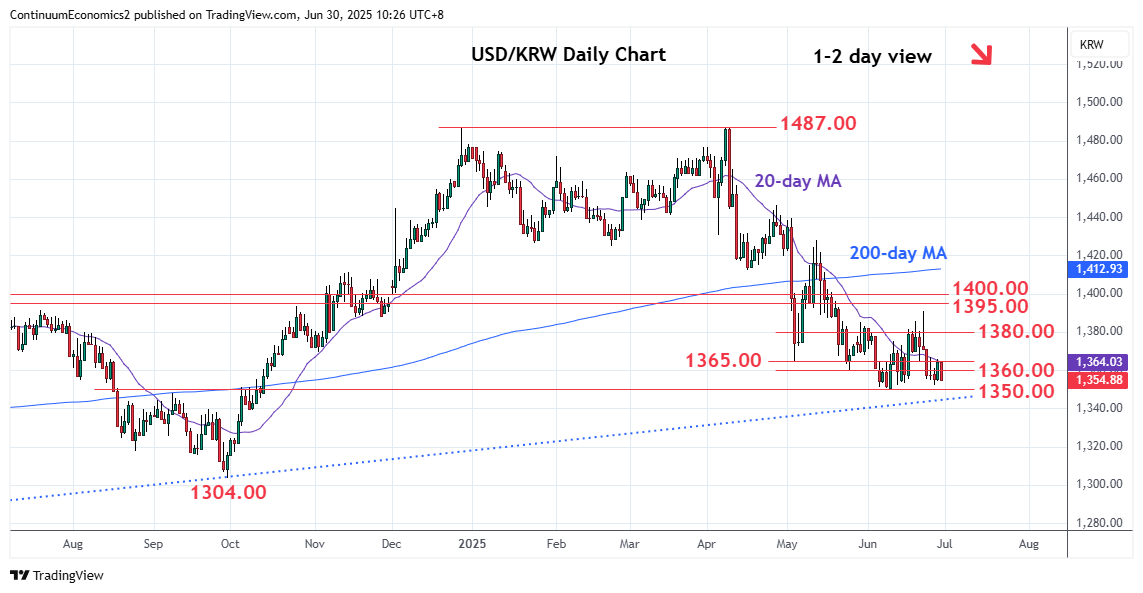
Limited on bounce from the 1352.00 low and risk seen for break here to extend losses from the 1390.00 high of last week
| Levels | Imp | Comment | Levels | Imp | Comment | |||
|---|---|---|---|---|---|---|---|---|
| R4 | 1395.00 | * | Jun 2024 high | S1 | 1351.00 | ** | 10 Jun YTD low | |
| R3 | 1390.00 | ** | 23 Jun high | S2 | 1345.00 | * | 2023 trend line | |
| R2 | 1380.00 | * | congestion | S3 | 1340.00 | * | congestion | |
| R1 | 1365.00 | * | 5 May low | S4 | 1330.00 | * | congestion |
Asterisk denotes strength of level
02:30 GMT - Limited on bounce from the 1352.00 low and risk seen for break here to extend losses from the 1390.00 high of last week. Break will expose the 10 June current year low at 1351.00 to retest and see scope for break to extend losses from the 1487.00, December/April double top to the trendline from 2023 year low at 1345.00. Oversold intraday and daily studies suggest possible reaction here though bearish price action from the April high should limit corrective bounce. Meanwhile, resistance at the 1360.00/1365.00 May lows is expected to cap and sustain losses from 1390.00 high.