Published: 2026-01-19T14:00:46.000Z
Chart USD/JPY Update: Under pressure
-
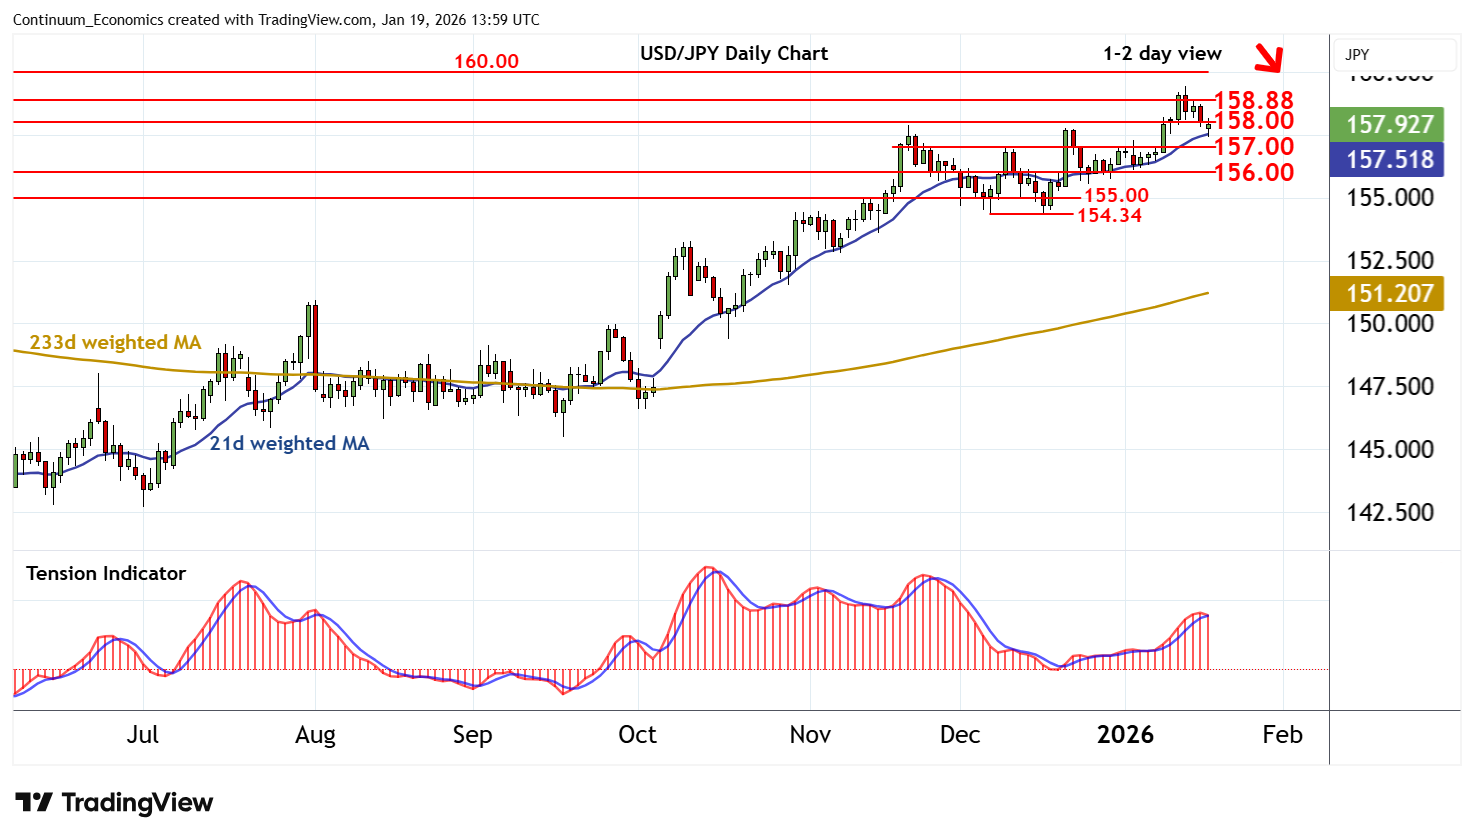
The anticipated break below 158.00 has bounced from 157.45~
| Levels | Imp | Comment | Levels | Imp | Comment | |||
|---|---|---|---|---|---|---|---|---|
| R4 | 160.00 | ** | congestion | S1 | 157.00 | congestion | ||
| R3 | 159.45 | * | 14 Jan YTD high | S2 | 156.00 | * | congestion | |
| R2 | 158.88 | ** | 10 Jan 2025 (y) high | S3 | 155.00 | * | break level | |
| R1 | 158.00 | * | break level | S4 | 154.34 | ** | 5 Dec (m) low |
Asterisk denotes strength of level
13:45 GMT - The anticipated break below 158.00 has bounced from 157.45~, with prices currently balanced in cautious trade just beneath 158.00. Intraday studies are rising, unwinding oversold areas, suggesting room for a test back above 158.00. But negative daily readings and deteriorating weekly charts should limit scope in renewed selling interest beneath the 158.88 year high of 10 January 2025. In the coming sessions, cautious trade is expected to give way to further losses, with focus to turn to congestion support at 157.00. Beneath here is 156.00.