Chart USD/CAD Update: Consolidating - background studies under pressure

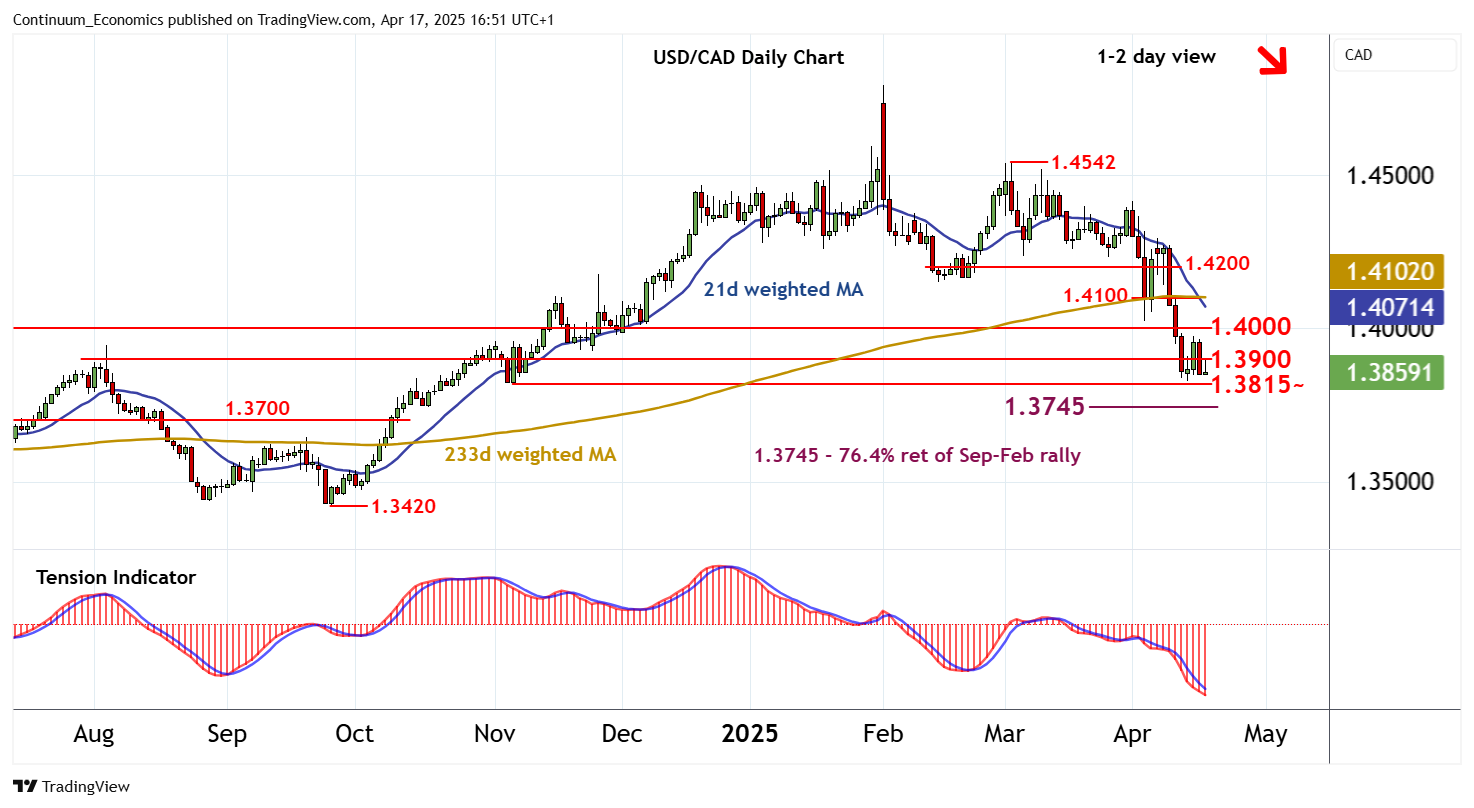
Little change, as prices extend consolidation above support at the 1.3828 current year low of 14 April and the 1.3815 monthly low of 6 November
| Levels | Imp | Comment | Levels | Imp | Comment | |||
|---|---|---|---|---|---|---|---|---|
| R4 | 1.4200 | congestion | S1 | 1.3828 | * | 14 Apr YTD low | ||
| R3 | 1.4100 | break level | S2 | 1.3815 | ** | 6 Nov (m) low | ||
| R2 | 1.4000 | * | break level | S3 | 1.3745 | ** | 76.4% ret of Sep-Feb rally | |
| R1 | 1.3900 | * | congestion | S4 | 1.3700 | ** | congestion |
Asterisk denotes strength of level
16:40 BST - Little change, as prices extend consolidation above support at the 1.3828 current year low of 14 April and the 1.3815 monthly low of 6 November. Oversold daily stochastics are edging higher, suggesting room for further cautious trade above here. But the daily Tension Indicator and broader weekly charts are bearish, suggesting potential for a later break beneath here. A close below 1.3815/28 will turn sentiment negative once again and extend February losses towards the 1.3745 Fibonacci retracement. Meanwhile, immediate resistance is at congestion around 1.3900. A close above here, if seen, will help to stabilise price action and prompt consolidation beneath 1.4000.