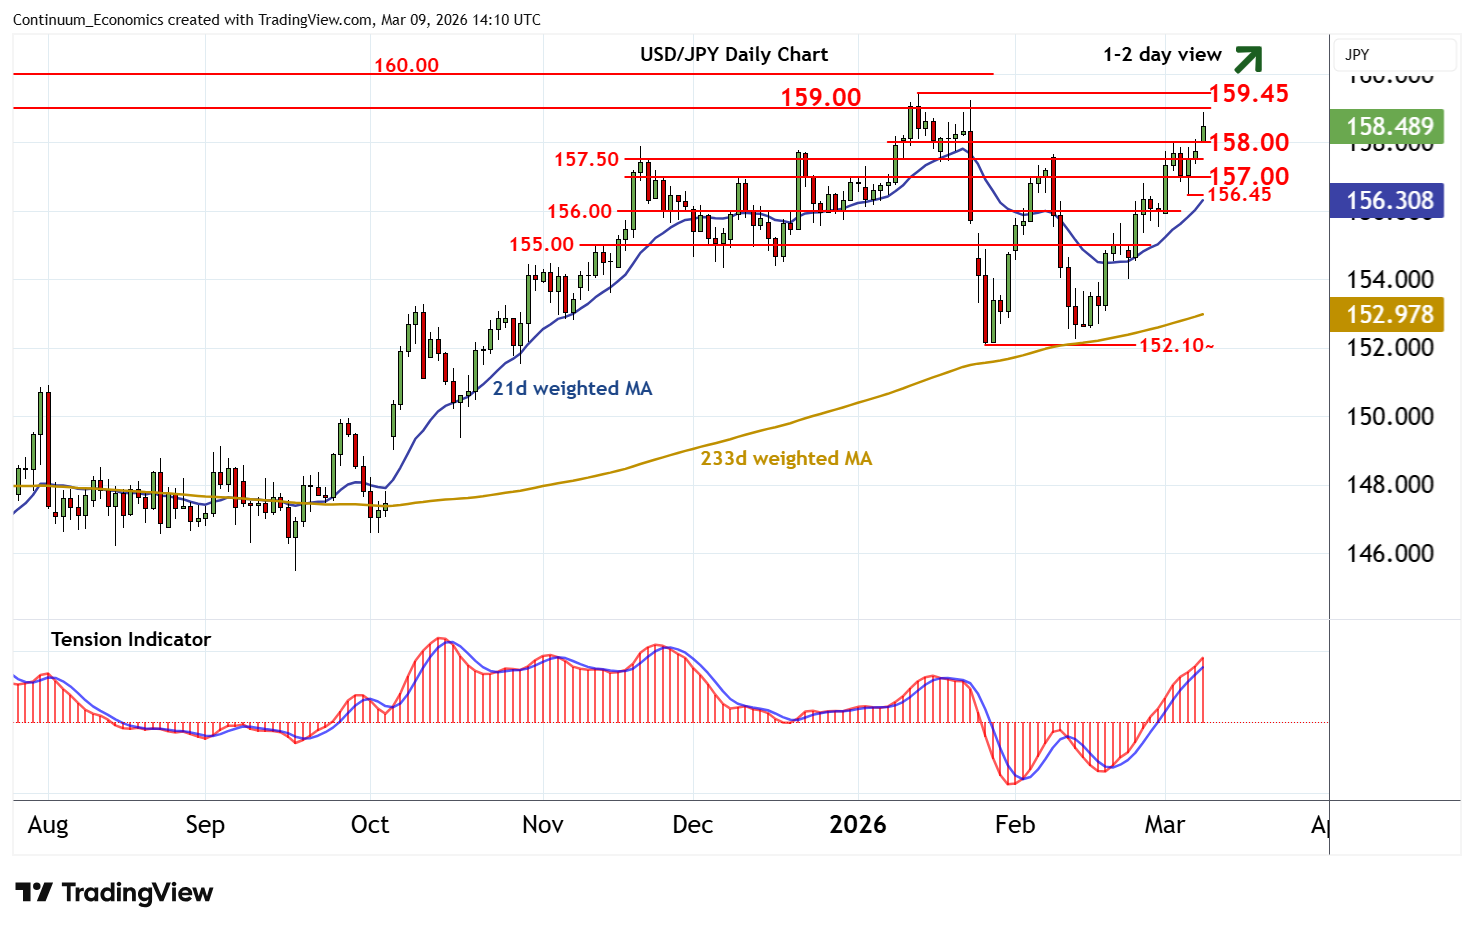
Chart USD/JPY Update: Approaching strong resistance
The anticipated test higher has met selling interest beneath congestion resistance at 159.00
| Levels | Imp | Comment | Levels | Imp | Comment | |||
|---|---|---|---|---|---|---|---|---|
| R4 | 160.40 | ** | 1990 high | S1 | 158.00 | * | break level | |
| R3 | 160.00 | ** | historic congestion | S2 | 157.00 | congestion | ||
| R2 | 159.45 | ** | 14 Jan YTD high | S3 | 156.45 | * | 4 Mar low | |
| R1 | 159.00 | * | congestion | S4 | 156.00 | * | congestion |
Asterisk denotes strength of level
13:55 GMT - The anticipated test higher has met selling interest beneath congestion resistance at 159.00, as overbought intraday studies unwind, with prices currently trading around 158.50. Daily readings are rising and broader weekly charts are also showing signs of improvement, highlighting room for further gains in the coming sessions. A close above critical resistance at the 159.45 current year high of 14 January is needed to turn sentiment positive, and confirm continuation of September 2024 gains. Focus will then turn to stronger resistance within 160.00/40. Meanwhile, support is raised to 158.00. A close beneath here, if seen, will help to stabilise price action and prompt consolidation above congestion around 157.00.