Published: 2025-08-20T00:24:57.000Z
Chart AUD/USD Update: Extending losses
0
2
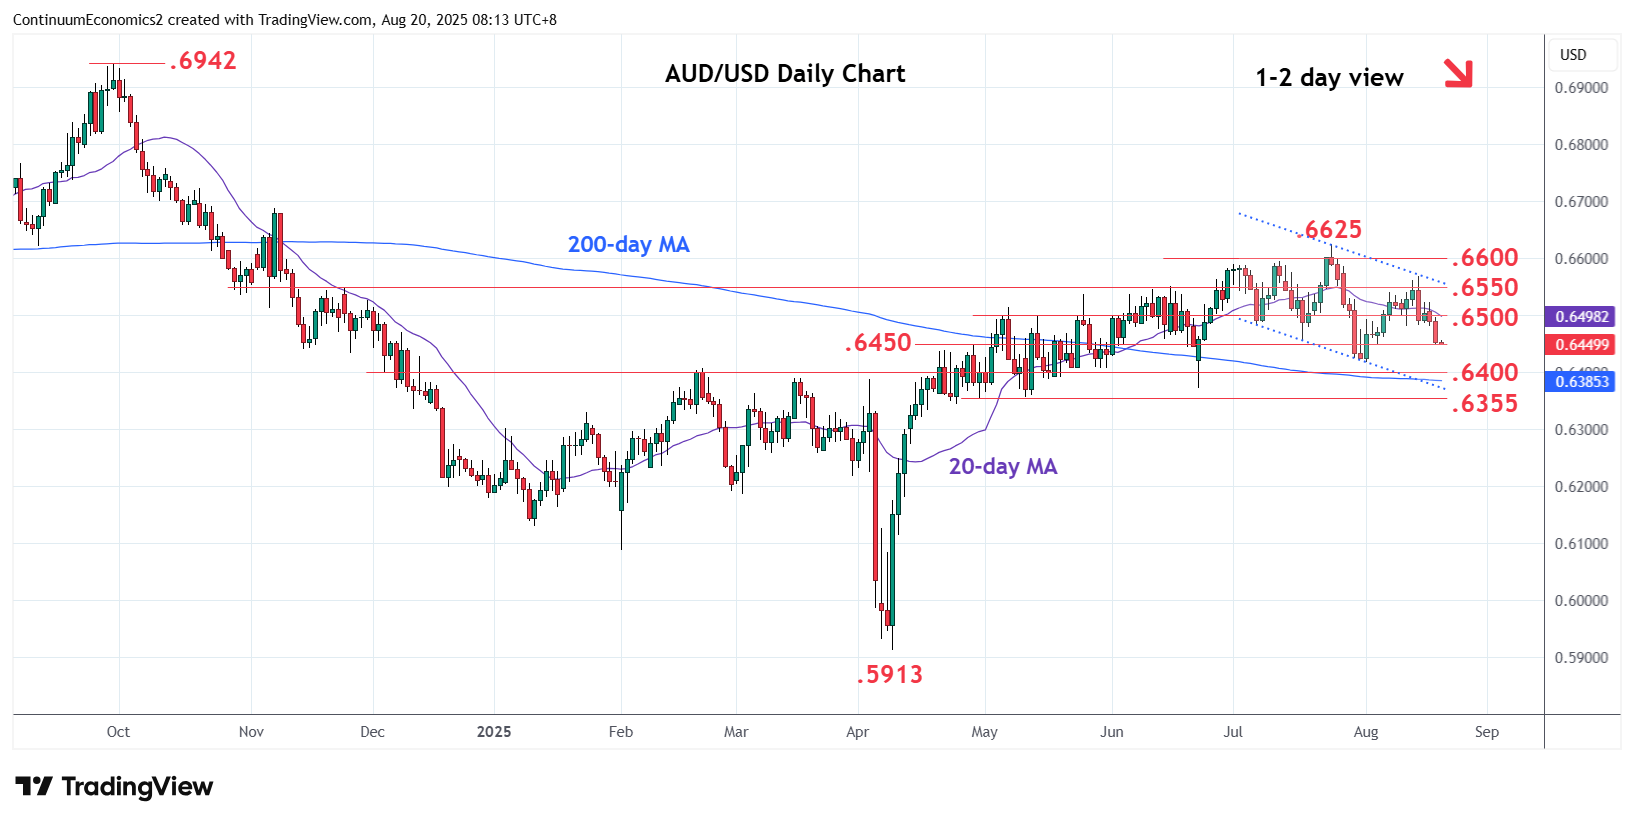
Break of the .6500/.6482 support see prices extending losses from the .6570 high to reach support at .6450
| Levels | Imp | Comment | Levels | Imp | Comment | |||
|---|---|---|---|---|---|---|---|---|
| R4 | 0.6625 | ** | 24 Jul YTD low | S1 | 0.6450 | * | congestion | |
| R3 | 0.6600 | * | congestion | S2 | 0.6418/00 | ** | 1 Aug low, congestion | |
| R2 | 0.6550/70 | ** | congestion, 14 Aug high | S3 | 0.6355 | ** | May low, 38.2% | |
| R1 | 0.6500 | * | congestion | S4 | 0.6300 | * | congestion |
Asterisk denotes strength of level
00:15 GMT - Break of the .6500/.6482 support see prices extending losses from the .6570 high to reach support at .6450 congestion. Negative daily and weekly studies suggest consolidation here to give way to break later to retest the .6418 low of 1st August. Below this will expose strong support at .6400/.6355 area and 38.2% Fibonacci level. Meanwhile, resistance is lowered to the .6482/.6500 area which is expected to cap and sustain losses from the .6570 high.