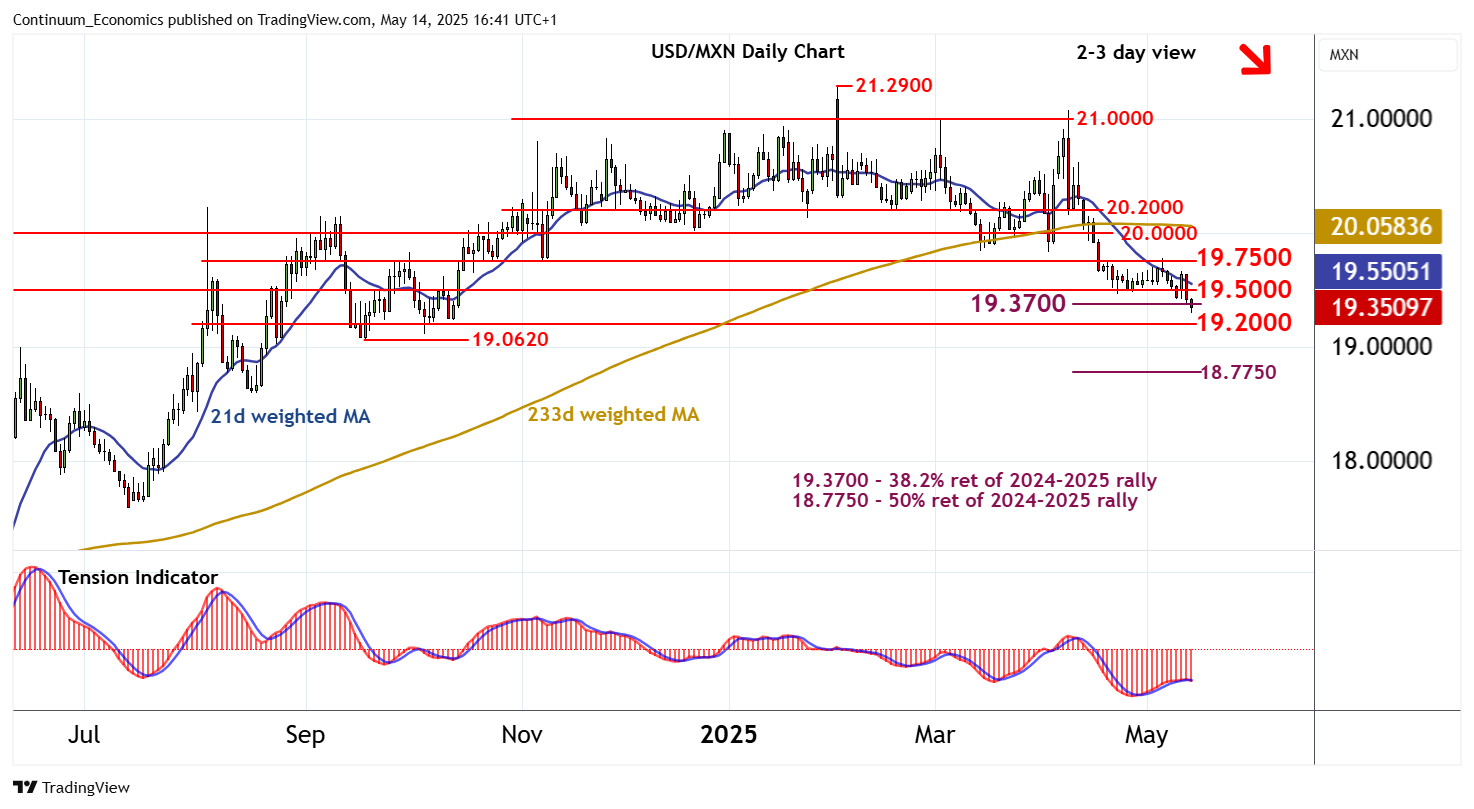
Chart USD/MXN Update: Under pressure

Cautious trade has given way to anticipated losses
| Levels | Imp | Comment | Levels | Imp | Comment | |||
|---|---|---|---|---|---|---|---|---|
| R4 | 20.0000 | * | congestion | S1 | 19.3700 | ** | 38.2% ret of 2024-2025 rally | |
| R3 | 19.8430 | ** | 14 Mar (m) low | S2 | 19.2000 | * | congestion | |
| R2 | 19.7500 | * | break level | S3 | 19.0620 | ** | 18 Sep (m) low | |
| R1 | 19.5000 | * | congestion | S4 | 19.0000 | * | congestion |
Asterisk denotes strength of level
16:30 BST - Cautious trade has given way to anticipated losses, with the break below 19.5000 adding weight to sentiment and prompting a test of support at the 19.3700 Fibonacci retracement. Oversold daily stochastics are flat, suggesting potential for consolidation around here. But the daily Tension Indicator is turning down and longer-term charts are under pressure, pointing to room for deeper losses in the coming sessions. A close below 19.3700 will add weight to sentiment and extend February losses initially towards congestion around 19.2000. Meanwihle, a close back above congestion resistance at 19.5000, if seen, will help to stabilise price action and give way to consolidation beneath 19.7500.