Published: 2026-03-04T01:47:58.000Z
Chart EUR/USD Update: Consolidating at 1.1600, potential for further losses
1
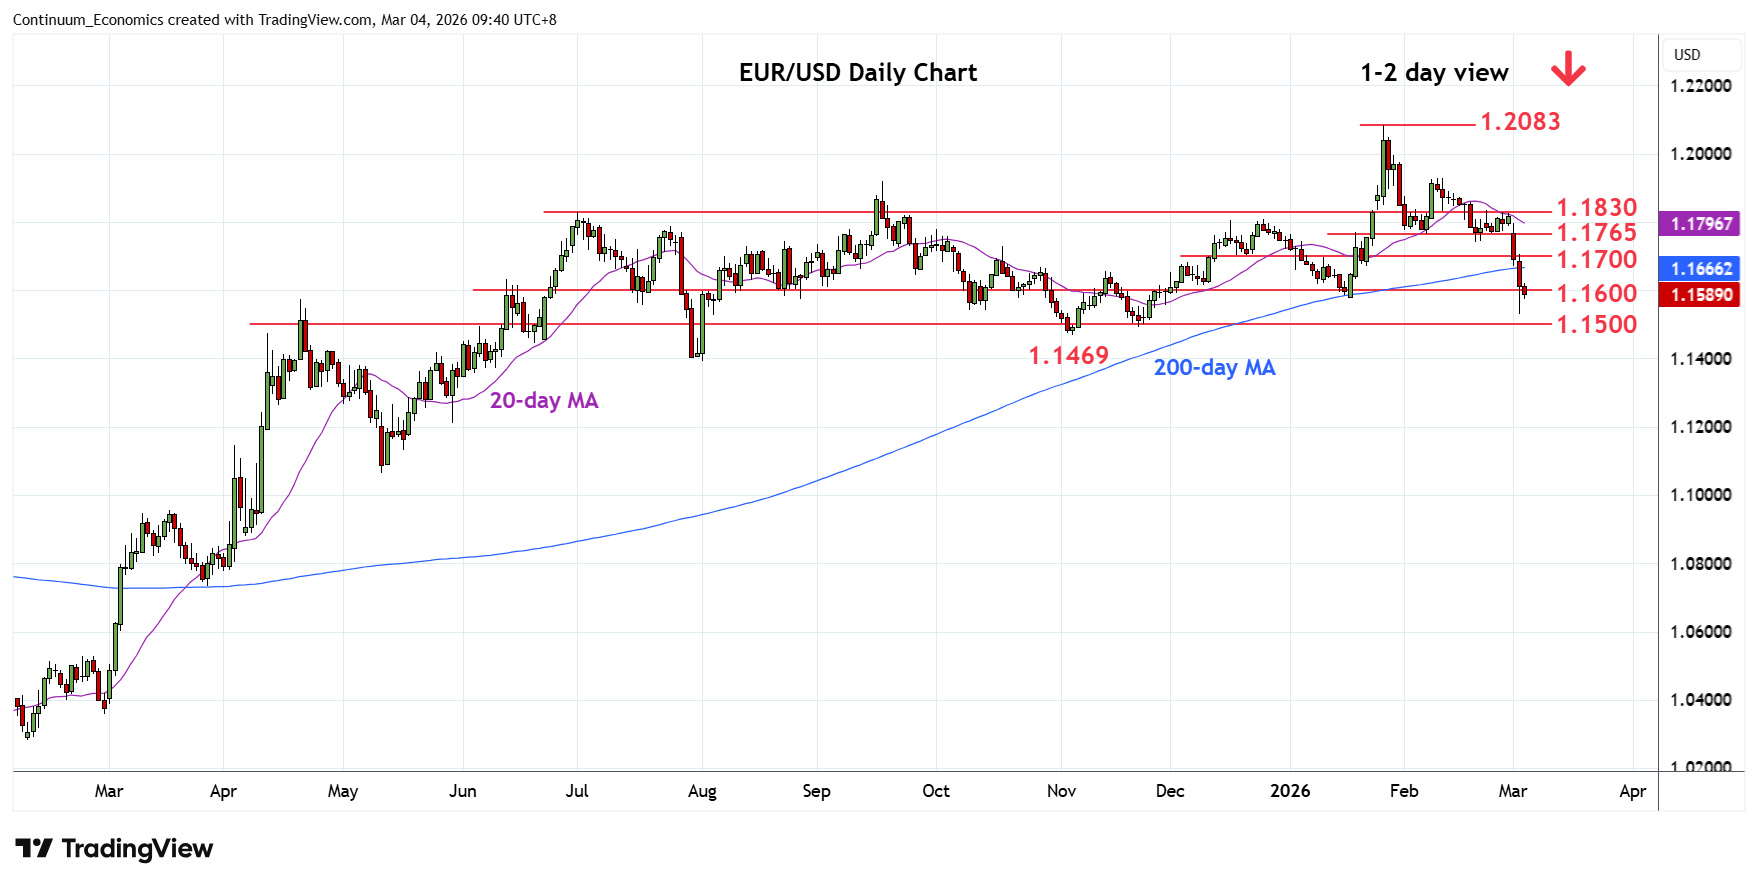
Turned up to the 1.1600 level as prices consolidate sharp losses following breakdown from the 1.1765/1.1742 support at the start of the week
| Levels | Imp | Comment | Levels | Imp | Comment | |||
|---|---|---|---|---|---|---|---|---|
| R4 | 1.1800/30 | ** | congestion, Jul high | S1 | 1.1530 | * | 3 Mar YTD low | |
| 14 | 1.1765 | * | 6 Feb low, congestion | S2 | 1.1500 | * | congestion | |
| R2 | 1.1700 | * | congestion | S3 | 1.1491 | * | 21 Nov low | |
| R1 | 1.1650 | congestion | S4 | 1.1469 | ** | 5 Nov low |
Asterisk denotes strength of level
01:40 GMT - Turned up to the 1.1600 level as prices consolidate sharp losses following breakdown from the 1.1765/1.1742 support at the start of the week. Losses through the 1.1578 January low has seen extension to fresh year low at 1.1530. Consolidation see prices unwind oversold intraday studies but negative daily and weekly charts keeps pressure on the downside. Below the 1.1530 low will see room to the 1.1500 level then the 1.1941/1.1469, November lows. Meanwhile, resistance is lowered to the 1.1650/1.1700 congestion area, now expected to cap.