Published: 2025-06-02T12:04:30.000Z
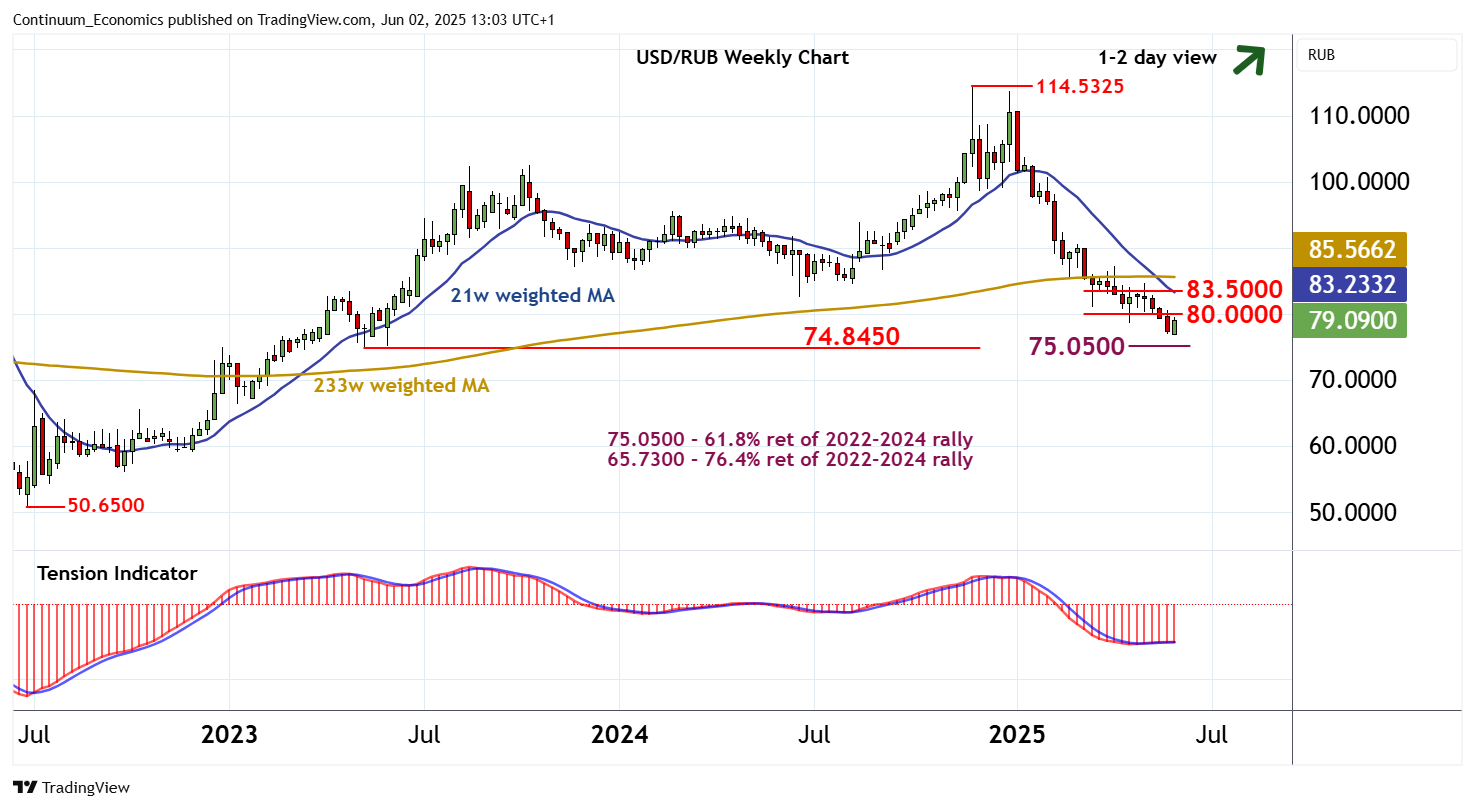
Chart USD/RUB Update: Bouncing from fresh 2025 year lows

Senior Technical Strategist
-
Anticipated losses have posted a fresh 2025 year low at 76.8600~
| Levels | Comment | Levels | Comment | |||||
| R4 | 85.0000 | ** | congestion | S1 | 76.8600~ | ** | 29 May YTD low | |
| R3 | 83.5000 | * | congestion | S2 | 75.0500 | ** | 61.8% ret of 2022-2024 rally | |
| R2 | 81.0000 | * | break level | S3 | 74.8450 | ** | May 2023 low | |
| R1 | 80.0000 | ** | congestion | S4 | 73.0000 | break level |
Asterisk denotes strength of level
12:50 BST - Anticipated losses have posted a fresh 2025 year low at 76.8600~, where a tick higher in daily stochastics is prompting a bounce towards congestion resistance at 80.0000. Oversold weekly stochastics are flattening, suggesting potential for a test above here. But the flat weekly Tension Indicator and mixed/negative longer-term charts are expected to limit scope in renewed selling interest towards congestion around 83.5000. Meanwhile, a close below 76.8600, not yet seen, will add weight to sentiment and extend November 2024 losses towards strong support at the 74.8450 low of May 2023 and the 75.0500 Fibonacci retracement.