Published: 2025-11-27T06:39:07.000Z
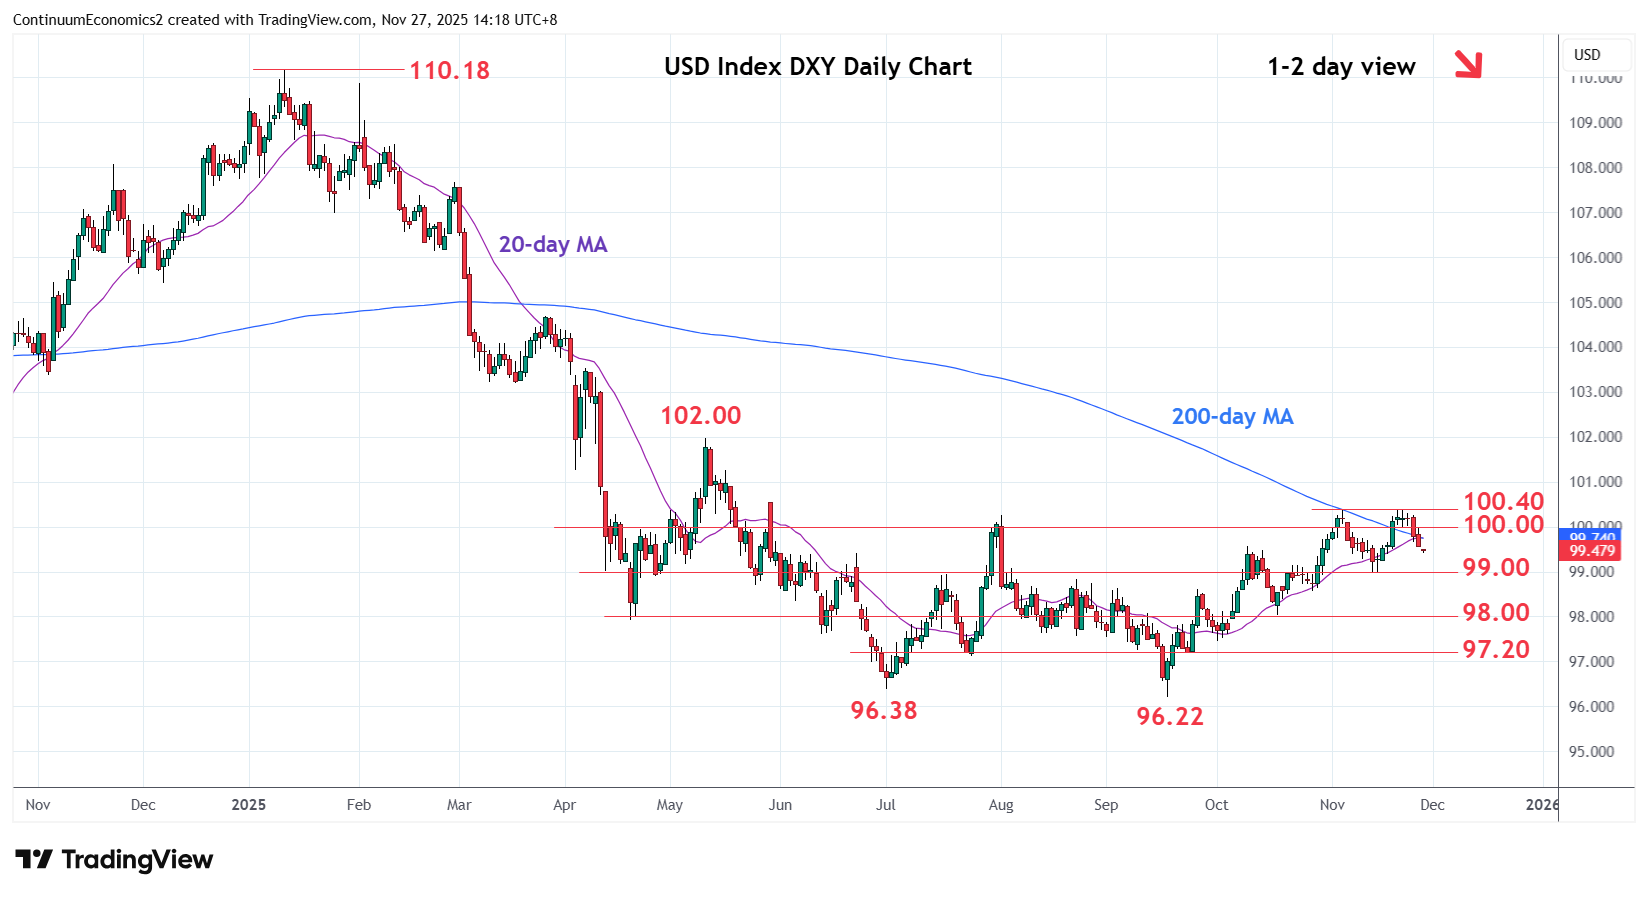
Chart USD Index DXY Update: Extending pullback from 100.40 high
-
Extending pullback from the 100.40 high with break of the 99.50 congestion opening up room for deeper pullback to support at the 99.00 congestion
| Levels | Imp | Comment | Levels | Imp | Comment | |||
|---|---|---|---|---|---|---|---|---|
| R4 | 101.00 | * | congestion | S1 | 99.00 | * | congestion | |
| R3 | 100.54 | 29 May high | S2 | 98.56 | * | 28 Oct low | ||
| R2 | 100.40 | ** | 21 Nov high | S3 | 98.00 | * | April low, congestion | |
| R1 | 100.00 | * | congestion | S4 | 97.46 | * | 1 Oct low |
Asterisk denotes strength of level
06:30 GMT - Extending pullback from the 100.40 high with break of the 99.50 congestion opening up room for deeper pullback to support at the 99.00 congestion. Daily studies are unwinding overbought readings and see risk for break here further retrace gains from the 96.22, September YTD low. Lower will see potential for extension to the 98.56 support then 98.00 April low and congestion area. Meanwhile, resistance at the 100.00 level is expected to cap and sustain losses from the 100.40 high.