Published: 2025-05-05T02:24:31.000Z
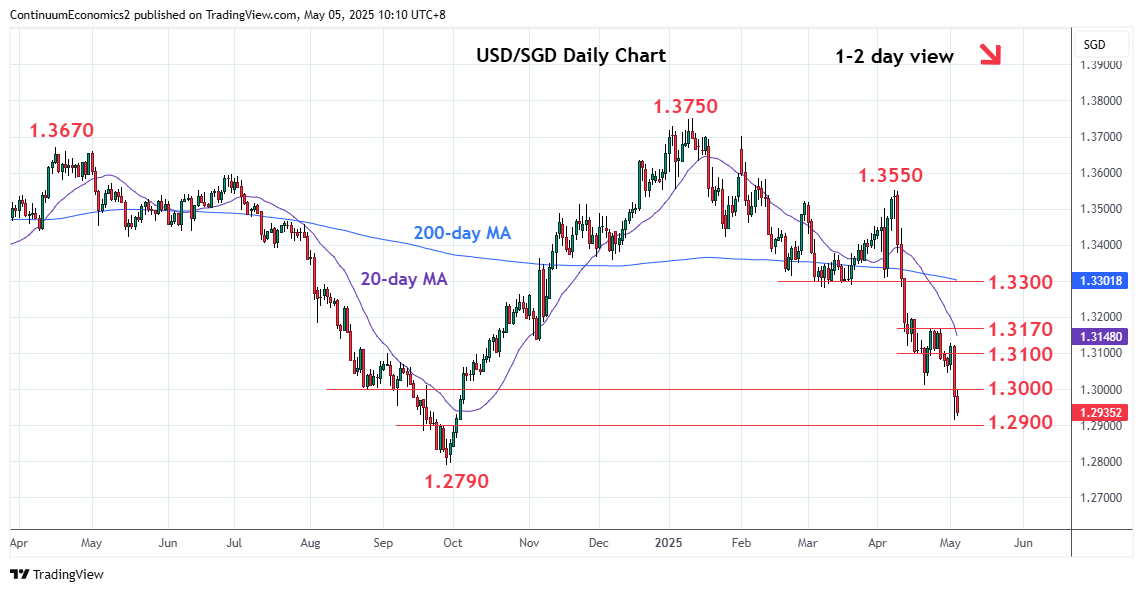
Chart USD/SGD Update: Under pressure

Technical Analyst
-
Turned up from the 1.2915 low as prices consolidate sharp losses last week
| Level | Comment | Level | Comment | ||||
|---|---|---|---|---|---|---|---|
| R4 | 1.3170 | ** | 23 Apr high | S1 | 1.2915 | ** | 2 May YTD low |
| R3 | 1.3100/30 | * | congestion, 1 May high | S2 | 1.2900 | * | congestion |
| R2 | 1.3050 | * | congestion | S3 | 1.2820 | * | intraday congestion |
| R1 | 1.3000/10 | ** | congestion, Apr low | S4 | 1.2790 | ** | Sep 2024 multi-year low |
Asterisk denotes strength of level
02:20 GMT - Turned up from the 1.2915 low as prices consolidate sharp losses last week from the 1.3170 resistance. However, pressure remains on the downside and see potential for break lower to extend losses from the 1.3750, January high. Lower will see scope to the 1.2900 congestion but focus will turn to the 1.2800/1.2790, congestion and September 2024 multi-year low. Meanwhile, resistance is lowered to the 1.3000/10 congestion and the low of April which is expected to cap. Above here will open up room for stronger bounce to the 1.3050 congestion and 1.3100/30 resistance.