Published: 2025-07-16T06:17:22.000Z
Chart USD/PHP Updates: Consolidating test of 57.000 level, room for higher

Technical Analyst
1
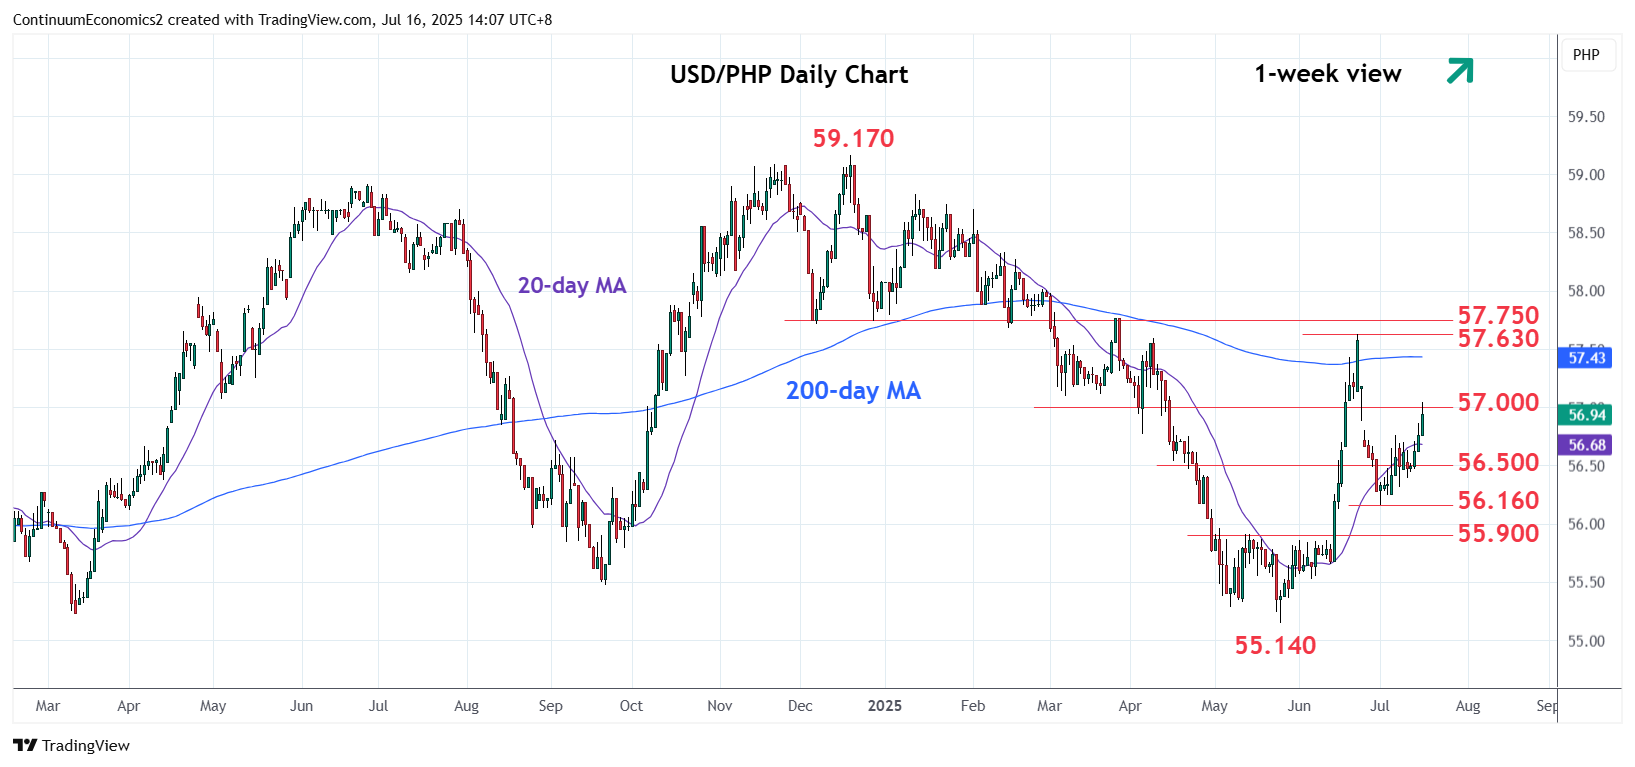
Break above 56.750 high of last week see prices extending bounce from the 56.160 low to reach 57.000 level
| Level | Comment | Level | Comment | |||||
|---|---|---|---|---|---|---|---|---|
| R4 | 57.700/750 | * | Dec lows, congestion | S1 | 56.750 | * | 7 Jul high | |
| R3 | 57.630 | ** | 23 Jun high, 61.8% | S2 | 56.500 | * | congestion | |
| R2 | 57.430 | * | 19 Jun high | S3 | 56.160 | * | 1 Jul low | |
| R1 | 57.000 | * | congestion | S4 | 55.900/850 | ** | 13 May high, congestion |
Asterisk denotes strength of level
06:10 GMT - Break above 56.750 high of last week see prices extending bounce from the 56.160 low to reach 57.000 level. Clearance here will room for extension to the 57.430 resistance then the 57.630, June high and 61.8% Fibonacci level. Gains beyond this, if seen, likely to see strong resistance at the 57.700/57.750 area capping. Corrective gains expected to give way to selling pressure later with support raised to 56.750 and extending to 57.500 congestion. Below these will return focus to the downside for retest of 56.560 low.