Chart USD/ZAR Update: Limited tests higher

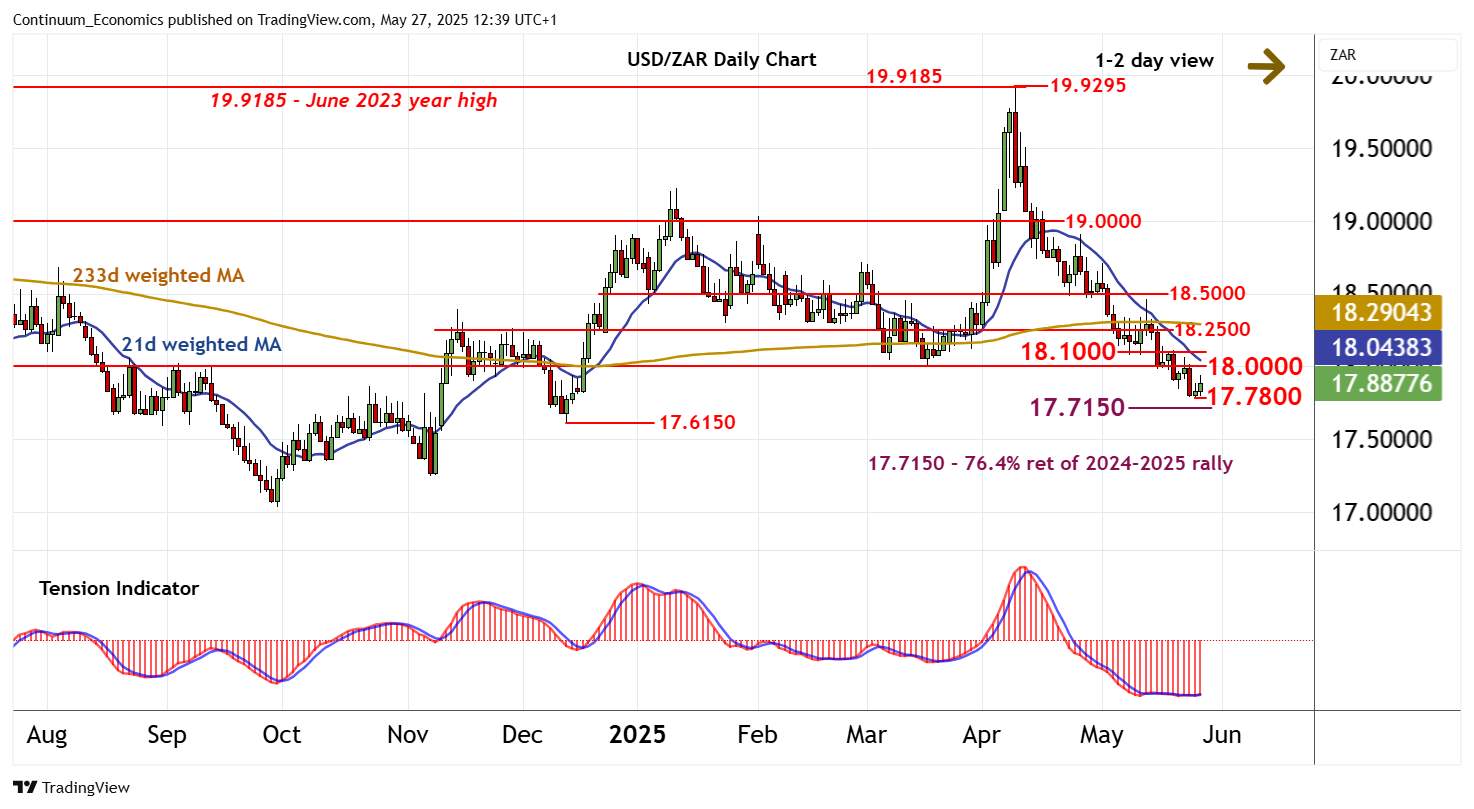
April losses have reached 17.7800, where rising intraday studies and improving daily readings are prompting a bounce
| Level | Comment | Level | Comment | |||||
|---|---|---|---|---|---|---|---|---|
| R4 | 18.5000 | ** | break level | S1 | 17.7800 | ** | 26 May low | |
| R3 | 18.2500 | * | congestion | S2 | 17.7150 | ** | 76.4% ret of 2024-2025 rally | |
| R2 | 18.1000 | * | break level | S3 | 17.6150 | ** | 12 Dec (m) low | |
| R1 | 18.0000 | ** | congestion | S4 | 17.5000 | * | congestion |
Asterisk denotes strength of level
12:20 BST - April losses have reached 17.7800, where rising intraday studies and improving daily readings are prompting a bounce. Focus is turning to congestion resistance at 18.0000 and the 18.1000 break level. But mixed/negative weekly charts are expected to limit any tests of this range in fresh consolidation. A break, if seen, will improve price action and extend (corrective) gains towards 18.2500. Following corrective trade, fresh losses are looked for. A later break below the 17.7800 low of 26 May will add weight to sentiment and extend April losses towards the 17.7150 Fibonacci retracement. A further break will open up 17.6150.