Published: 2026-01-19T00:49:05.000Z
Chart USD/JPY Update: Extending pullback from 159.45 high
1
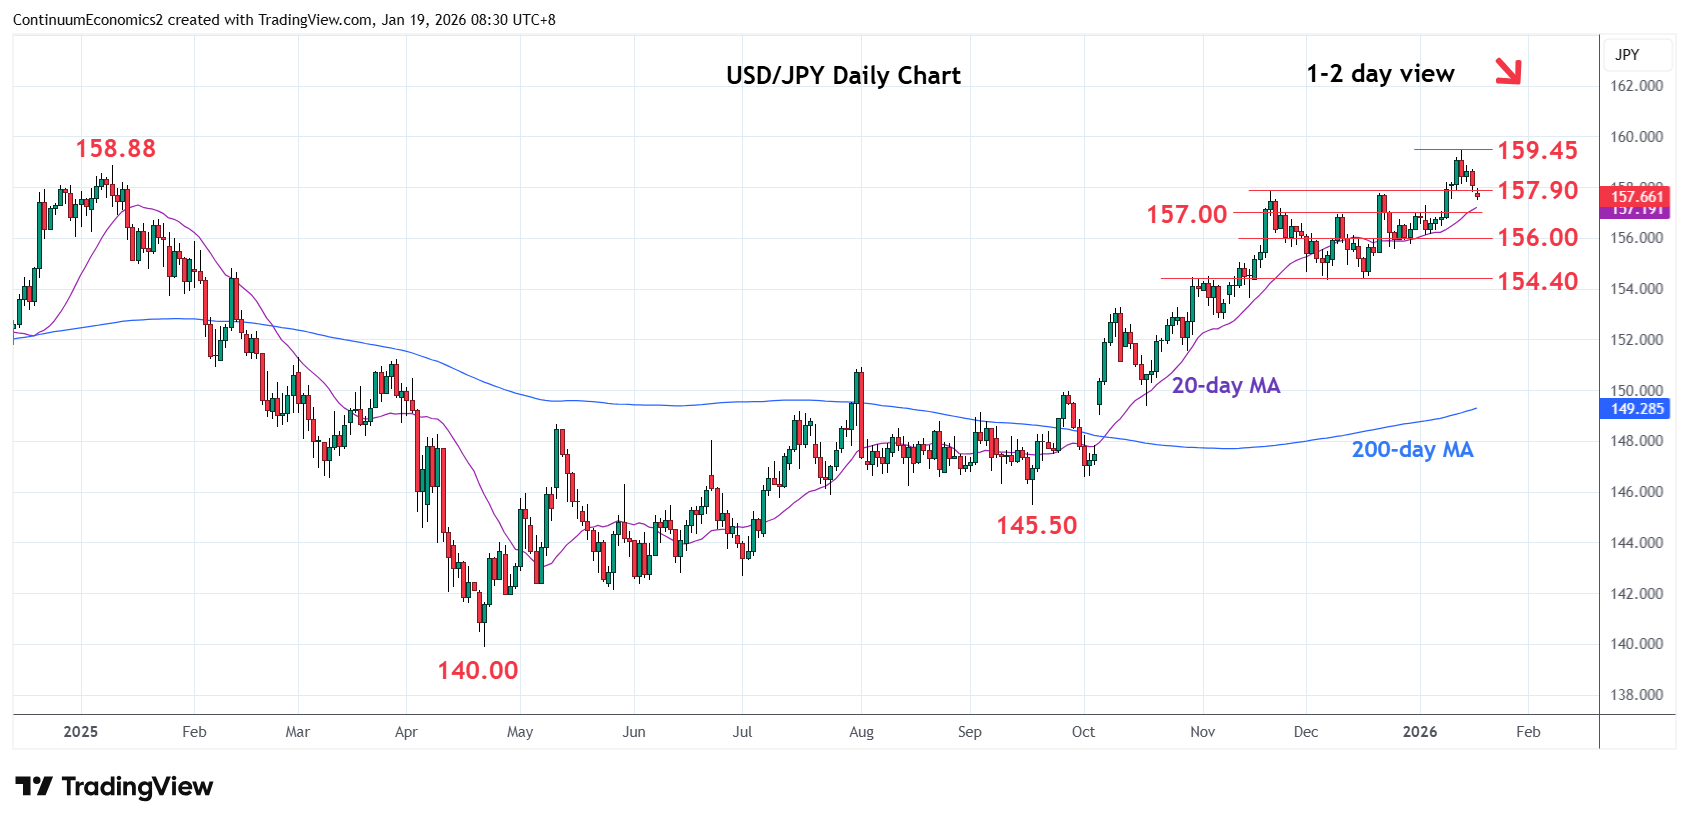
Break of the 157.90 support see prices extending pullback from the 159.45 high and unwinding the overbought daily studies
| Levels | Imp | Comment | Levels | Imp | Comment | |||
|---|---|---|---|---|---|---|---|---|
| R4 | 161.00 | * | congestion | S1 | 157.30 | 5 Jan high | ||
| R3 | 160.00 | * | figure, congestion | S2 | 157.00 | * | congestion | |
| R2 | 159.45 | ** | 14 Jan YTD high | S3 | 156.00 | * | congestion | |
| R1 | 158.88 | * | Jan 2025 year high | S4 | 154.40/35 | ** | Dec lows |
Asterisk denotes strength of level
00:40 GMT - Break of the 157.90 support see prices extending pullback from the 159.45 high and unwinding the overbought daily studies. Lower see room for deeper pullback to retrace gains from the 154.40 December low to support at the 157.30/00 area. Below this will see room to the 156.00/155.50 congestion area. Meanwhile, resistance at the 158.88 and 159.45 highs are expected to cap. Break here, if seen, will further extend gains from the 2024/2025 double bottom to the 160.00 figure. Beyond this will turn focus to the 161.95, the July 2024 year high.