Published: 2026-02-02T00:27:42.000Z
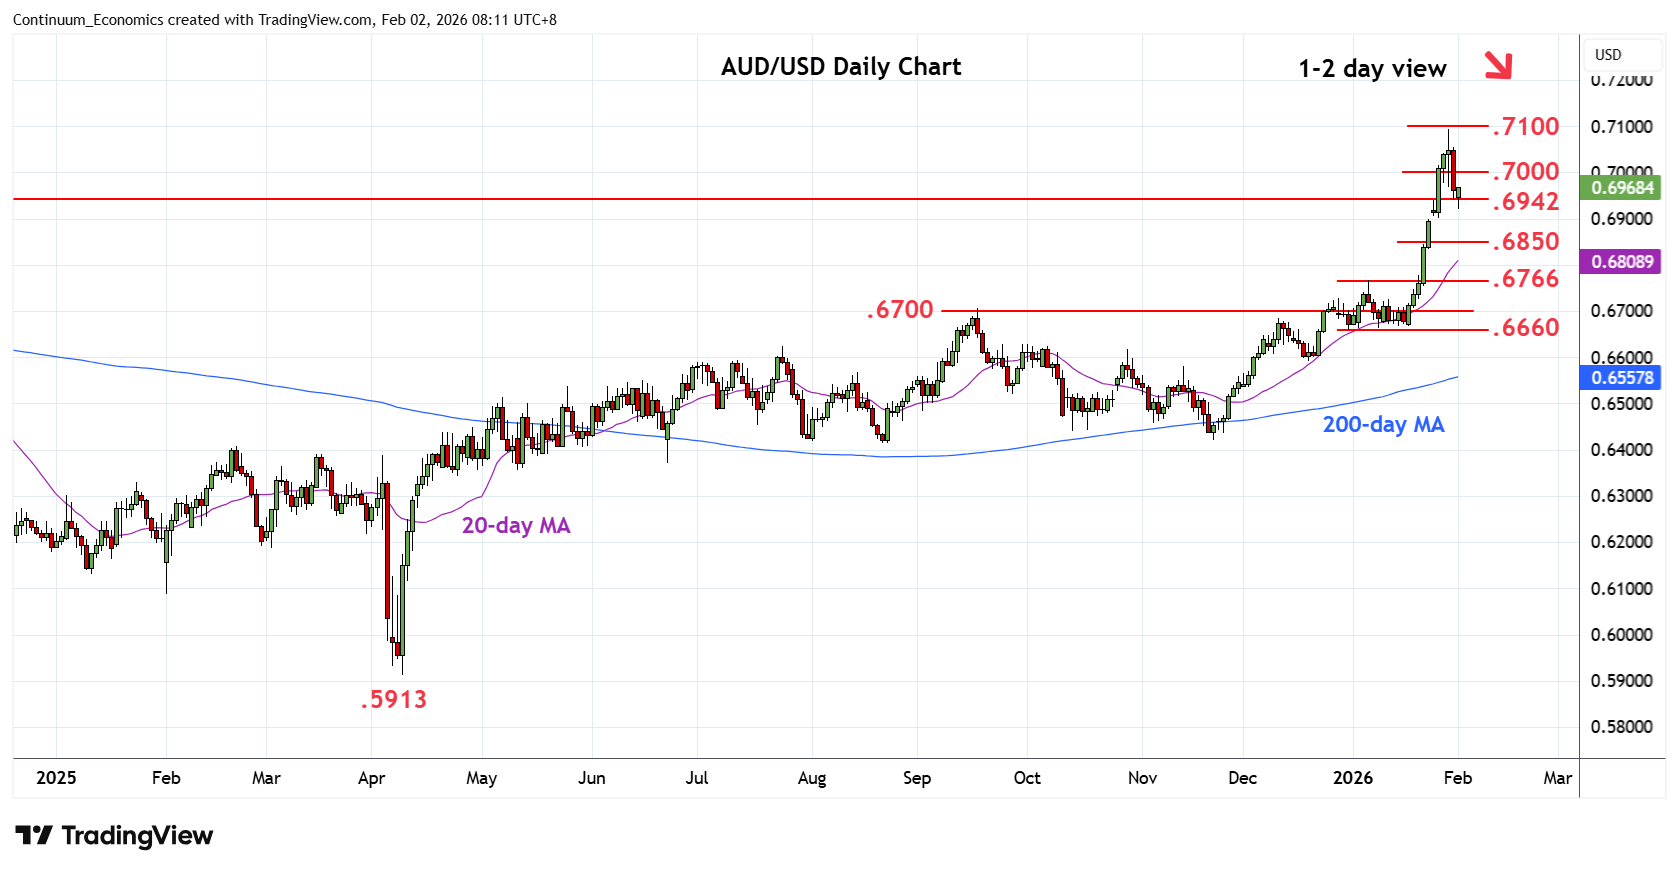
Chart AUD/USD Update: Consolidating test of .6942/00 support
-
Lower at the opening to reach .6920 low before turning higher as prices consolidate losses from the .7094 high
| Levels | Imp | Comment | Levels | Imp | Comment | |||
|---|---|---|---|---|---|---|---|---|
| R4 | 0.7158 | ** | Feb 2023 year high | S1 | 0.6942 | * | 2024 year high | |
| R3 | 0.7094 | ** | 29 Jan YTD high | S2 | 0.6900 | ** | 23 Jan high, gap | |
| R2 | 0.7050 | * | congestion | S3 | 0.6850 | * | congestion | |
| R1 | 0.7000 | * | congestion | S4 | 0.6800 | * | congestion |
Asterisk denotes strength of level
00:20 GMT - Lower at the opening to reach .6920 low before turning higher as prices consolidate losses from the .7094 high. Daily studies are unwinding overbought readings and suggest room for deeper corrective pullback to retrace recent strong gains from the .6660, early-January lows. Break of support at the .6942/.6900, 2024 year high and gap area, will open up room for deeper pullback to .6850/.6800 support. Meanwhile, resistance is lowered to the .7000 level which is now expected to cap and sustain pullback from the .7094 high.