Published: 2025-10-03T07:31:57.000Z
Chart GBP/JPY Update: Higher in consolidation from 197.50 low
1
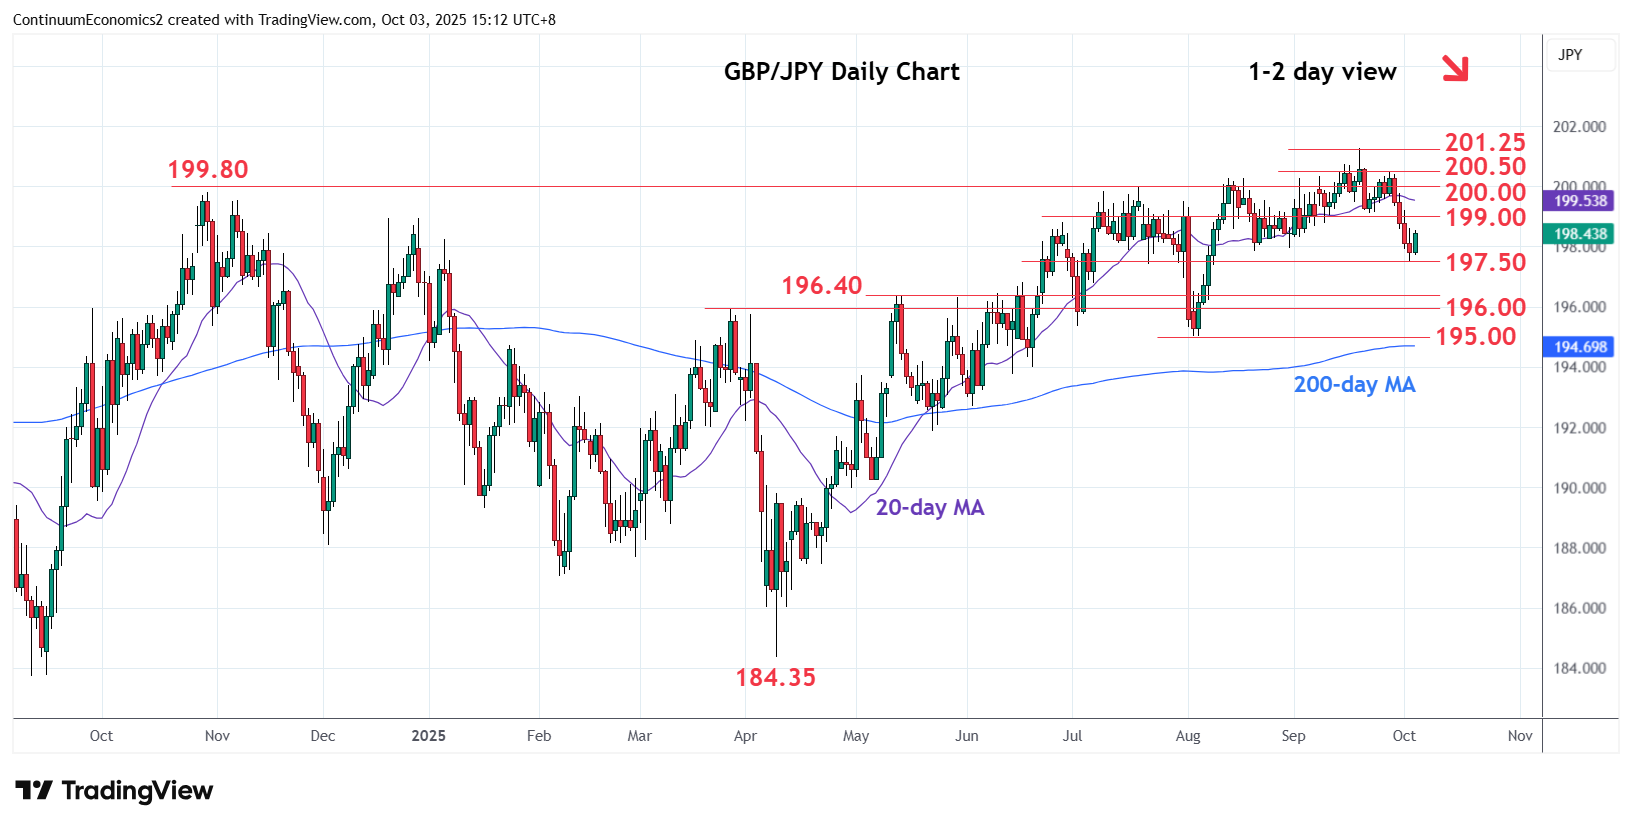
Turned up from the 197.50 low as prices consolidate losses from the 200.50 high of last week
| Levels | Imp | Comment | Levels | Imp | Comment | |||
|---|---|---|---|---|---|---|---|---|
| R4 | 201.25 | ** | 18 Sep YTD high | S1 | 198.00 | * | congestion | |
| R3 | 200.50 | * | 26 Sep high | S2 | 197.50 | * | 2 Oct low | |
| R2 | 200.00 | * | Jul high, congestion | S3 | 196.40 | * | May high | |
| R1 | 199.00/10 | * | congestion, 22 Sep low | S4 | 196.00 | ** | Mar high |
Asterisk denotes strength of level
07:30 GMT - Turned up from the 197.50 low as prices consolidate losses from the 200.50 high of last week. Bounce see prices unwinding oversold intraday and daily studies but this is expected to give way to renewed selling pressure later open up deeper pullback to retrace gains from the 195.00, August low. Lower will see room for extension to the strong support at the 196.40/196.00, May and March highs. Meanwhile, resistance at the 199.00/10 congestion and 22 September low is expected to cap corrective bounce.