Published: 2025-12-01T05:18:47.000Z
Chart USD Index DXY Update: Under pressure
1
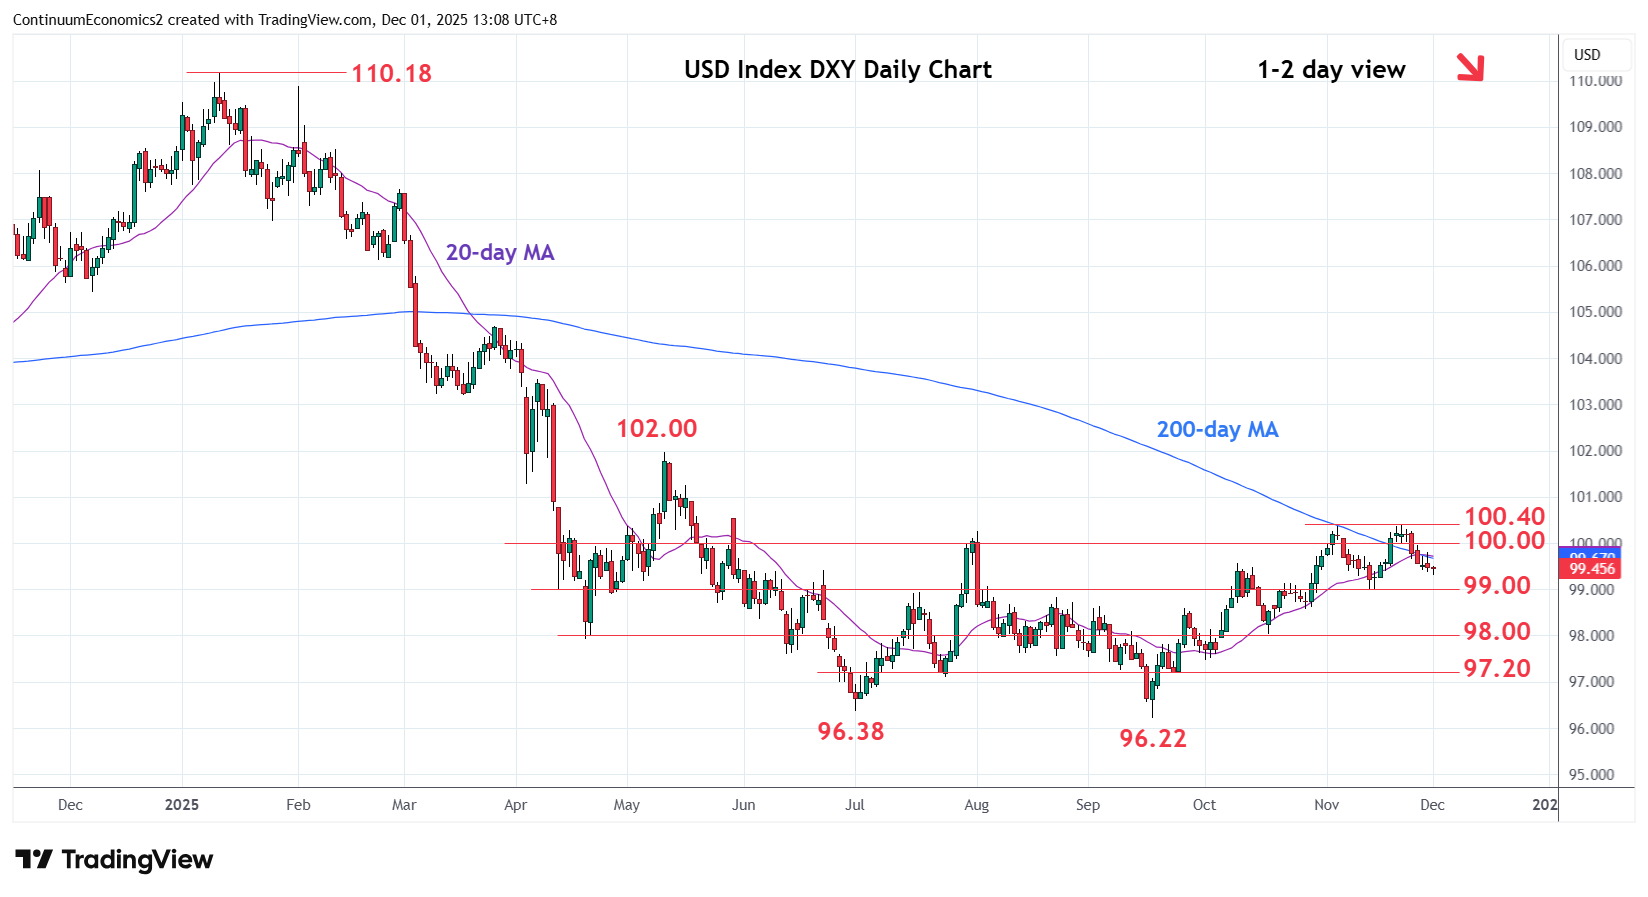
Under pressure as prices extend pullback from the 100.36/100.40, November highs
| Levels | Imp | Comment | Levels | Imp | Comment | |||
|---|---|---|---|---|---|---|---|---|
| R4 | 101.00 | * | congestion | S1 | 99.00 | * | congestion | |
| R3 | 100.54 | 29 May high | S2 | 98.56 | * | 28 Oct low | ||
| R2 | 100.40 | ** | 21 Nov high | S3 | 98.00 | * | April low, congestion | |
| R1 | 100.00 | * | congestion | S4 | 97.46 | * | 1 Oct low |
Asterisk denotes strength of level
05:15 GMT - Under pressure as prices extend pullback from the 100.36/100.40, November highs. Daily studies continue to track lower and suggest room to extend losses towards support at the 99.00 congestion. Break here will confirm a double top at the 100.36/100.40 highs and further retrace gains from the 96.22, September YTD low. Lower will see potential to the 98.56 support then 98.00 April low and congestion area. Meanwhile, resistance at the 100.00 level is expected to cap and sustain losses from the 100.40 high.