Published: 2026-01-09T09:08:09.000Z
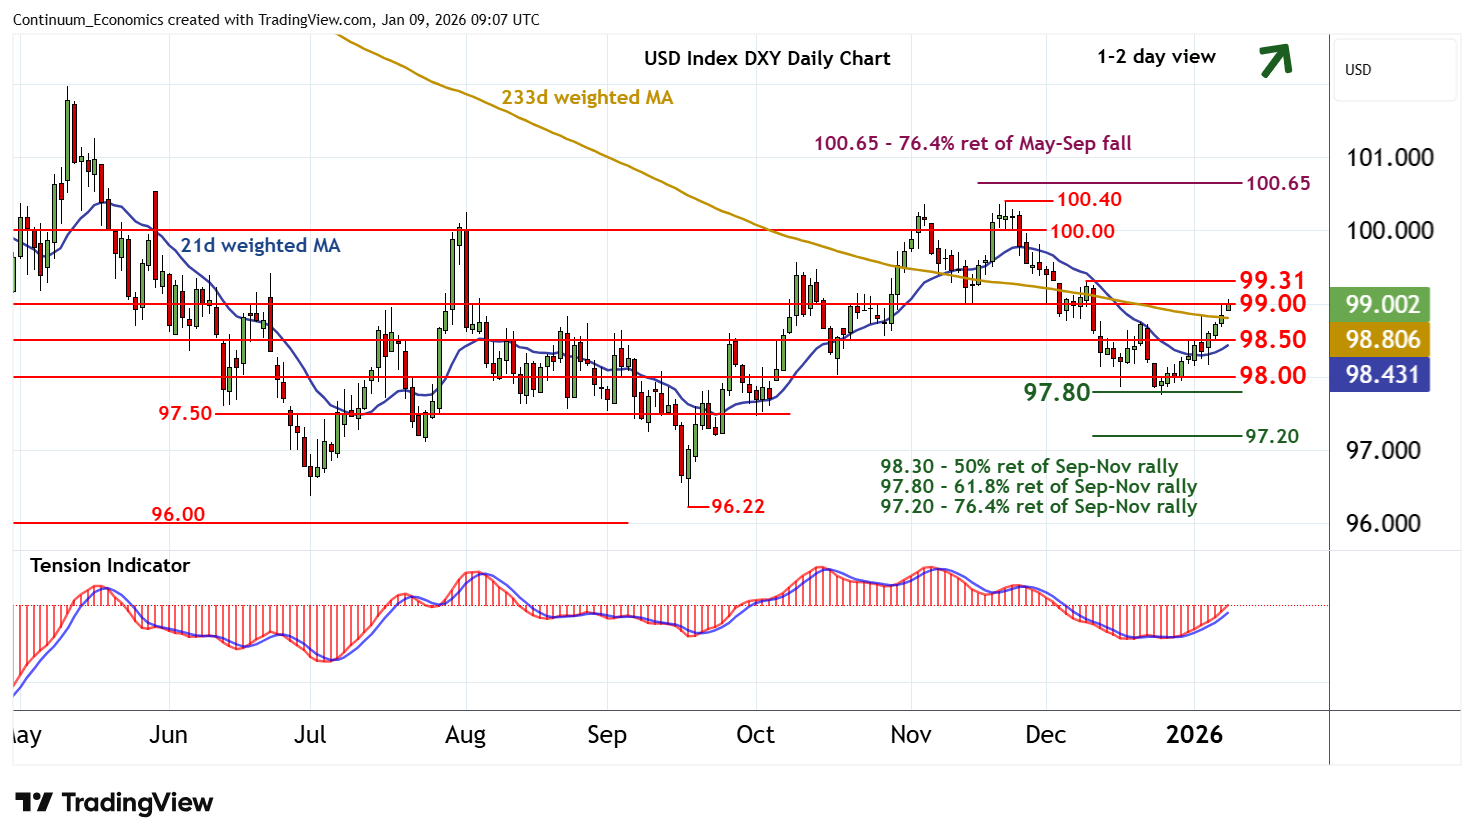
Chart USD Index DXY Update: Resistance within 99.00/31
3
No change to the modestly positive tone
| Levels | Imp | Comment | Levels | Imp | Comment | |||
|---|---|---|---|---|---|---|---|---|
| R4 | 100.40 | ** | 21 Nov (m) high | S1 | 98.50 | * | congestion | |
| R3 | 100.00 | ** | congestion | S2 | 98.00 | * | congestion | |
| R2 | 99.31 | * | 9 Dec (w) high | S3 | 97.80 | ** | 61.8% ret of Sep-Nov rally | |
| R1 | 99.00 | * | congestion | S4 | 97.50 | congestion |
Asterisk denotes strength of level
09:00 GMT - No change to the modestly positive tone, as intraday studies tick higher, with prices extending gains to currently pressure congestion resistance at 99.00. The rising daily Tension Indicator highlights room for a break above here towards the 99.31 weekly high of 9 December. But flattening overbought daily stochastics and bearish weekly charts are expected to limit any tests of this 99.00/31 range in renewed selling interest. Meanwhile, support remains at congestion around 98.50 and should underpin any immediate setbacks.