Continuum Economics
  • Search
  • About Us
  • Buy
  • Invite A Friend
  • My Basket
  • Articles
  • Calendar
  • Forecasts
  • Events
  • Data
  • Newsletters
  • My Alerts
  • Community
  • Directory
  • About Us
  • Buy
  • Invite A Friend
  • My Basket
  • Articles
    • All
    • Thematic
    • Tactical
    • Asia
    • EMEA
    • Americas
    • Newsletters
    • Freemium
    • Editor's Choice
    • Most Viewed
    • Most Shared
    • Most Liked
  • Calendar
    • Interactive
      • China
      • United States
      • Eurozone
      • United Kingdom
    • Month Ahead
    • Reviews
    • Previews
  • Forecasts
    • Forecasts
    • Key Views
  • Events
    • Media
    • Conference Calls
  • Data
    • Country Insights
    • Shadow Credit Ratings
    • Full CI Data Download
  • Newsletters
  • My Alerts
  • Community
    • FX
    • Fixed Income
    • Macro Strategy
    • Credit Markets
    • Equities
    • Commodities
    • Precious Metals
    • Renewables
  • Directory
  • My Account
  • Notifications Setup
  • Administration Panel
  • Account Details
  • Recent Devices
  • Distribution Lists
  • Shared Free Trials
  • Saved Articles
  • Shared Alerts
  • My Posts
Published: 2025-12-23T13:27:15.000Z

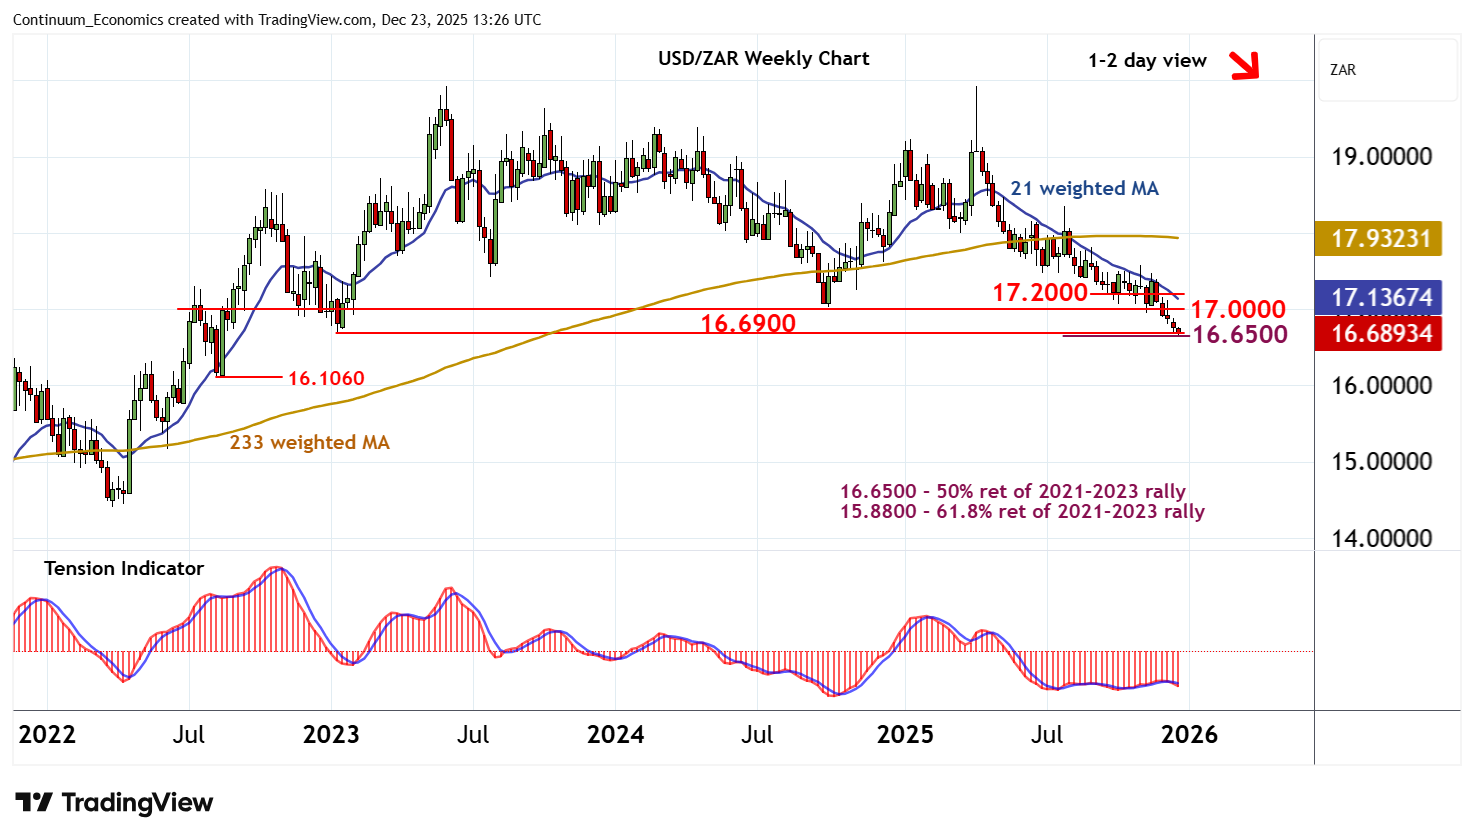
Chart USD/ZAR Update: Pressuring support at the 16.6500 Fibonacci retracement

1

Little change, as prices post a fresh year low within strong support at the 16.6900 year low of January 2023 and the 16.6500 Fibonacci retracement

 Level Comment  Level Comment
R4 17.5000**congestion S1 16.6900**January 2023 (y) low
R3 17.4000*congestion S2 16.6625 fresh 2025 (y) low
R2 17.2000*congestion S3 16.6500**50% ret of 2021-2023 rally
R1 17.0000**congestion S4 16.1060**August 2022 low

Asterisk denotes strength of level

12:15 GMT - Little change, as prices post a fresh year low within strong support at the 16.6900 year low of January 2023 and the 16.6500 Fibonacci retracement. Oversold daily stochastics are rising, suggesting potential for consolidation around here. But the daily Tension Indicator is negative and broader weekly charts are bearish, highlighting difficulty sustaining any immediate gains. Fresh selling interest is expected to appear into any bounce towards congestion resistance at 17.0000. Following cautious trade, fresh losses are looked for. A later close below 16.6500 will add weight to sentiment and extend April losses towards the 16.1060 low of August 2022.

Continue to read the article for free
Login

or

or

Topics
USD/ZAR-TA
Technical Analysis
EEMEA-Technical

GENERAL

  • Home
  • About Us
  • Our Team
  • Careers

LEGAL

  • Terms and Conditions
  • Privacy Policy
  • Compliance
  • GDPR

GET IN TOUCH

  • Contact Us
Continuum Economics
The Technical Analyst Awards Winner 2021
The Technical Analyst Awards Finalist 2020
image