Chart GBP/USD Update: Consolidating
Little change, as mixed intraday studies keep near-term sentiment cautious and extend consolidation within the 1.3600 - 1.3650 range
| Level | Comment | Level | Comment | |||||
|---|---|---|---|---|---|---|---|---|
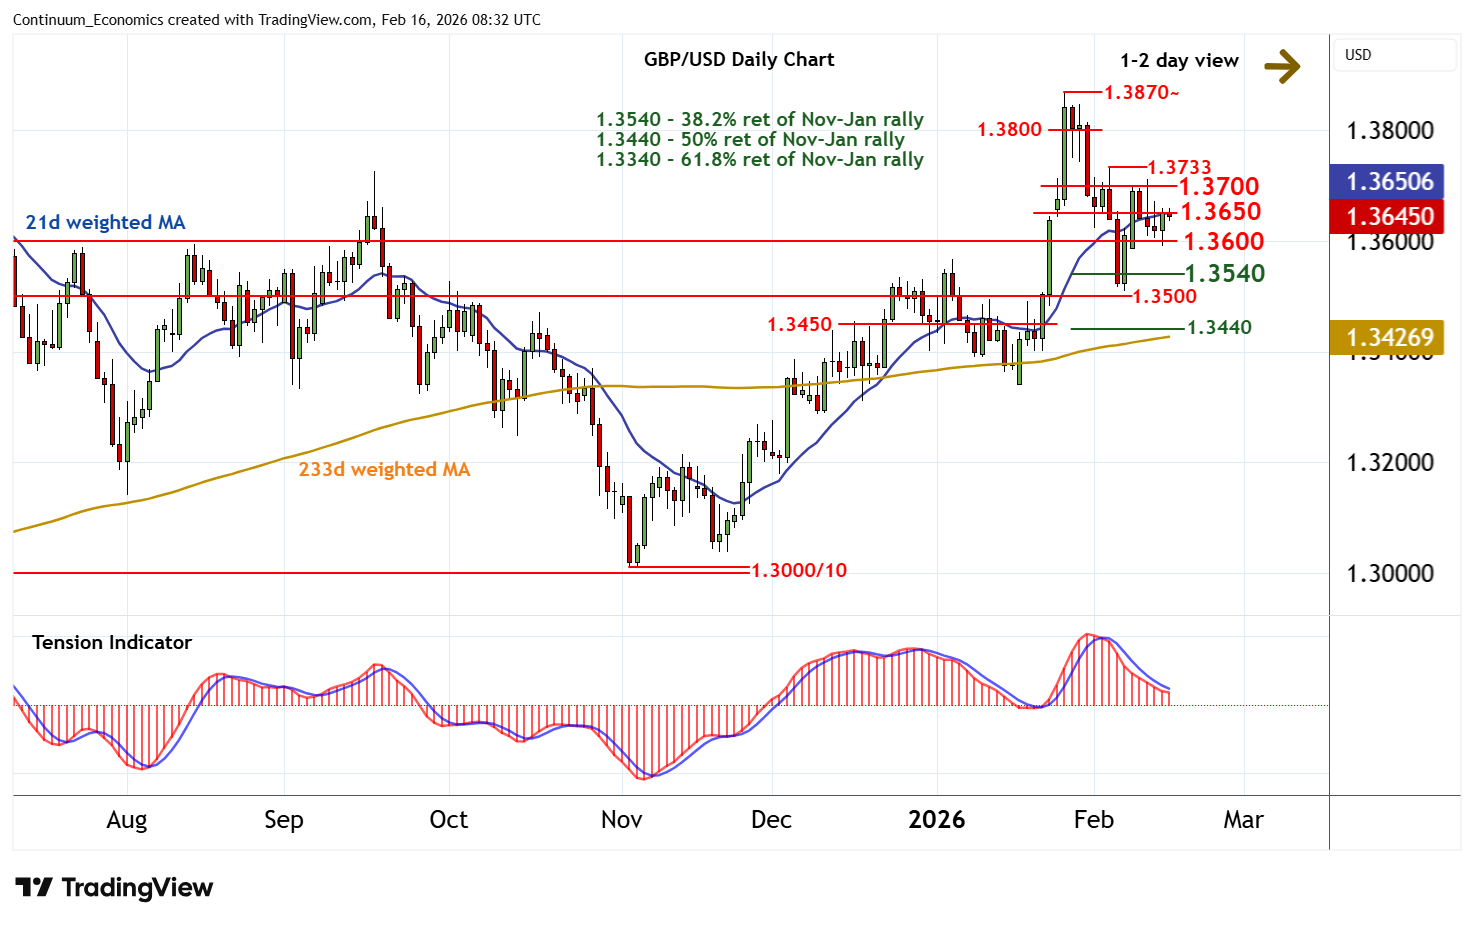
| R4 | 1.3800 | * | congestion | S1 | 1.3600 | * | congestion | |
| R3 | 1.3733 | * | 4 Feb (w) high | S2 | 1.3540 | * | 38.2% ret of Nov-Jan rally | |
| R2 | 1.3700 | break level | S3 | 1.3500/10~ | ** | congestion; 6 Feb (w) low | ||
| R1 | 1.3650 | * | break level | S4 | 1.3440/50 | ** | 50% ret; congestion |
Asterisk denotes strength of level
08:10 GMT - Little change, as mixed intraday studies keep near-term sentiment cautious and extend consolidation within the 1.3600 - 1.3650 range. A tick higher in flat daily stochastics highlights potential for a test above 1.3650. But the negative daily Tension Indicator and unwinding overbought weekly stochastics should limit scope in renewed selling interest towards 1.3700. Meanwhile, support remains at congestion around 1.3600. Any immediate tests beneath here should give way to consolidation above the 1.3540 Fibonacci retracement. A close below strong support at 1.3500/10, however, would turn sentiment negative and confirm continuation of late-January losses.