Published: 2026-03-24T07:42:17.000Z
Chart AUD/JPY Update: Consolidating test of 110.80/110.00 support
3
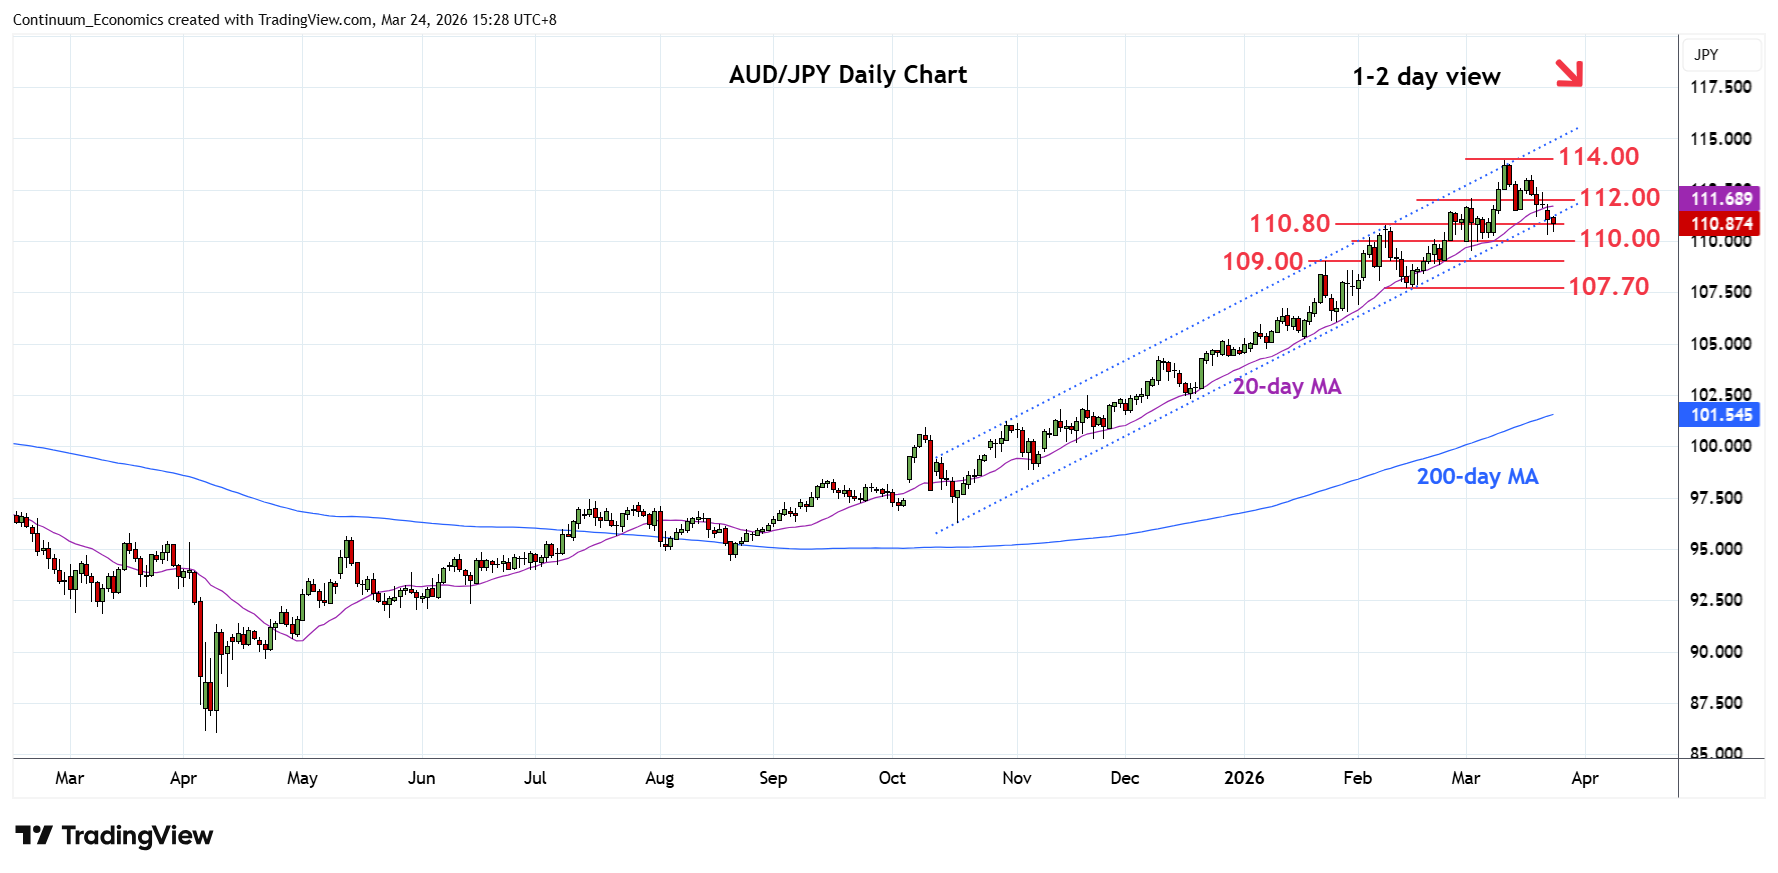
Pullback from the 114.00 high and channel resistance has seen losses to reach support at the 110.80/110.00 congestion area
| Levels | Imp | Comment | Levels | Imp | Comment | |||
|---|---|---|---|---|---|---|---|---|
| R4 | 114.00 | ** | 11 Mar YTD high | S1 | 110.80 | ** | 9 Feb high | |
| R3 | 113.20 | * | 18 Mar high | S2 | 110.00 | * | congestion | |
| R2 | 112.00 | ** | 3 Mar high, congestion | S3 | 109.00 | ** | Jan high | |
| R1 | 111.50 | * | 13 Mar low | S4 | 107.70 | * | 13 Feb low |
Asterisk denotes strength of level
07:35 GMT - Pullback from the 114.00 high and channel resistance has seen losses to reach support at the 110.80/110.00 congestion area. Consolidation here see prices unwinding oversold intraday and daily studies. However, the downside still vulnerable and lower will see room for deeper pullback to 109.00 level and 108.00/107.70 support. Meanwhile, resistance is lowered to the 111.50/112.00, 13 March low and congestion area which is expected to cap. Clearance here, will return focus to the upside for retest of the 113.20 and 114.00 March highs.