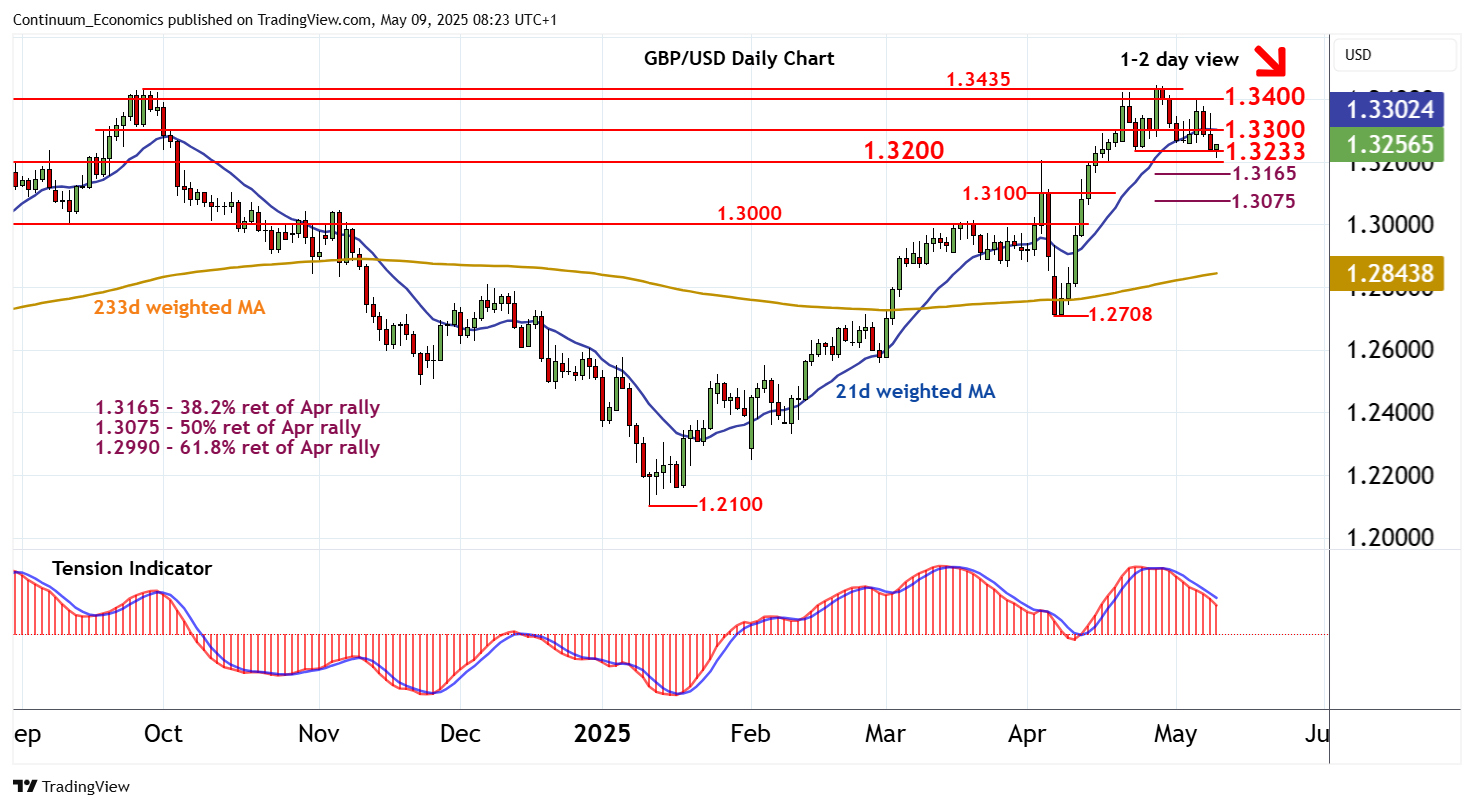
Chart GBP/USD Update: Reached 1.3200/33 - studies continue to track lower

Choppy trade has given way to the test of strong support at the 1.3200 break level and the 1.3233 weekly low of 23 April
| Level | Comment | Level | Comment | |||||
|---|---|---|---|---|---|---|---|---|
| R4 | 1.3500 | ** | congestion | S1 | 1.3233 | * | 23 Apr (w) low | |
| R3 | 1.3435 | ** | 26 Sep 2024 (y) high | S2 | 1.3200 | ** | break level | |
| R2 | 1.3400 | congestion | S3 | 1.3165 | ** | 38.2% ret of Apr rally | ||
| R1 | 1.3300 | break level | S4 | 1.3100 | * | break level |
Asterisk denotes strength of level
08:10 BST - Choppy trade has given way to the test of strong support at the 1.3200 break level and the 1.3233 weekly low of 23 April. A tick higher in oversold intraday studies is prompting a bounce from this range. But bearish daily readings and unwinding overbought weekly stochastics are expected to limit any corrective bounce in renewed selling interest beneath resistance at 1.3300. Following cautious trade, fresh losses are looked for. A close below 1.3200/33 will complete a near-term distribution top beneath the 1.3435 year high of 26 September 2024, and add weight to sentiment, as focus then turns to support at 1.3200. Beneath here is the 1.3165 Fibonacci retracement. Meanwhile, a close back above 1.3300, if seen, will help to stabilise price action and prompt consolidation beneath congestion around 1.3400.