Published: 2025-10-30T00:14:05.000Z
Chart AUD/USD Update: Consolidating test of .6600/25 resistance
1
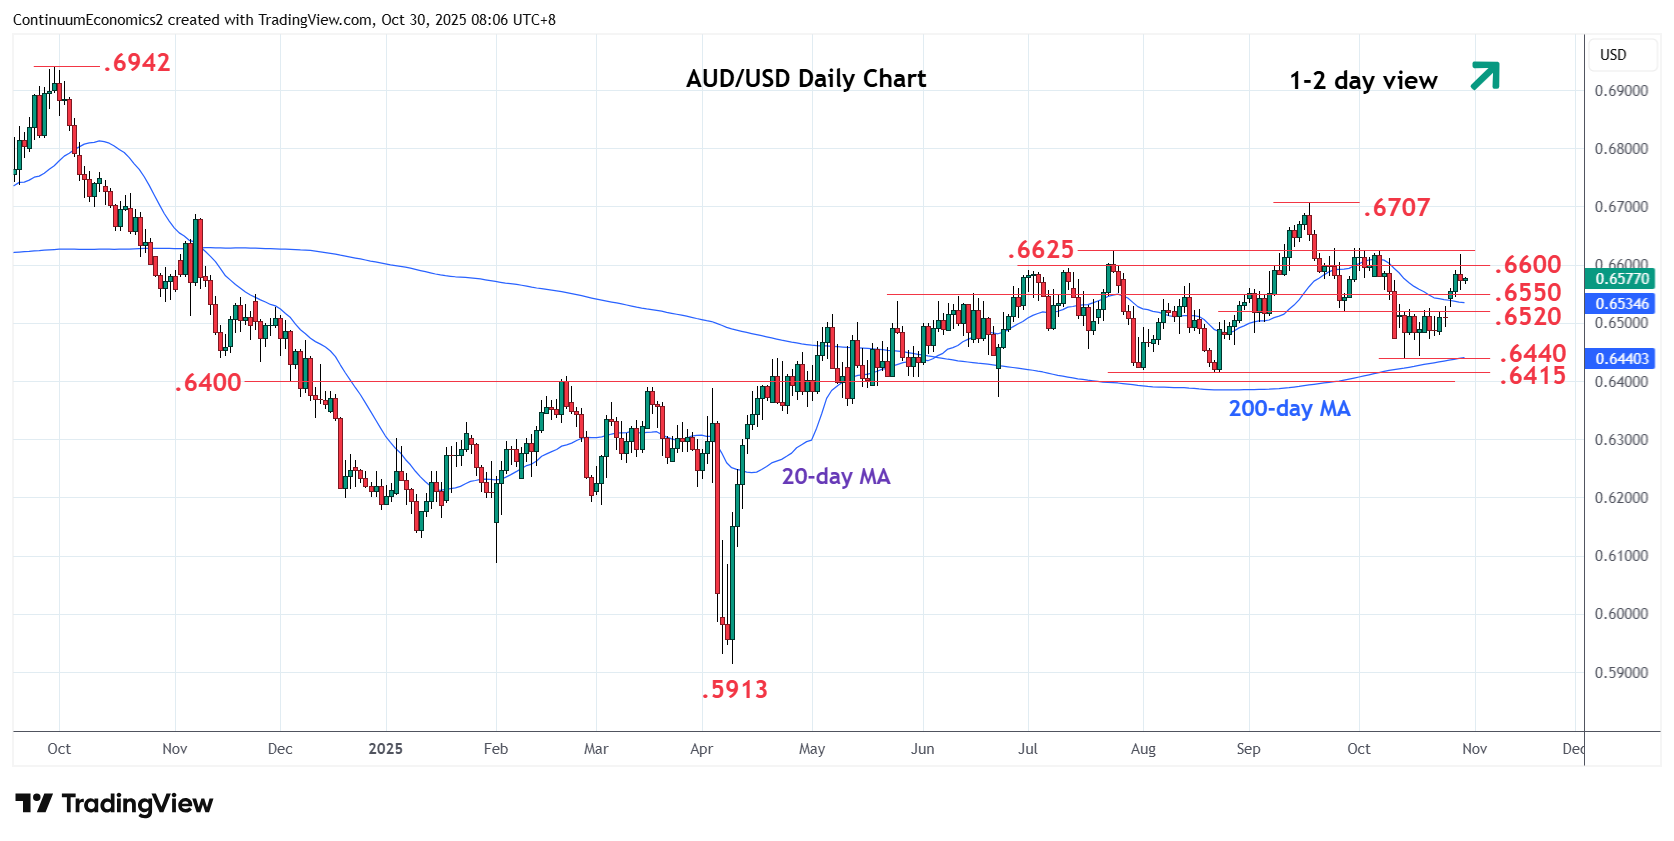
Test of strong resistance at the .6600/25 area has seen prices giving way to consolidation
| Levels | Imp | Comment | Levels | Imp | Comment | |||
|---|---|---|---|---|---|---|---|---|
| R4 | 0.6707 | ** | 17 Sep YTD high | S1 | 0.6550 | * | congestion | |
| R3 | 0.6660 | 18 Sep high | S2 | 0.6520/00 | * | 26 Sep low, congestion | ||
| R2 | 0.6625 | ** | Jul high, congestion | S3 | 0.6470 | * | 10 Oct low | |
| R1 | 0.6600 | * | congestion | S4 | 0.6440 | ** | 14 Oct low |
Asterisk denotes strength of level
00:10 GMT - Test of strong resistance at the .6600/25 area has seen prices giving way to consolidation to unwind overbought intraday studies. Daily chart are stretched as well but bullish structure suggest consolidation giving way to renewed buying interest later. Clearing the .6600/25 resistance will return focus to the .6700 level and .6707, current year high. Meanwhile, support is at the .6550 congestion. Below this will open up room for deeper corrective pullback and see consolidation towards the .6520/00 support.